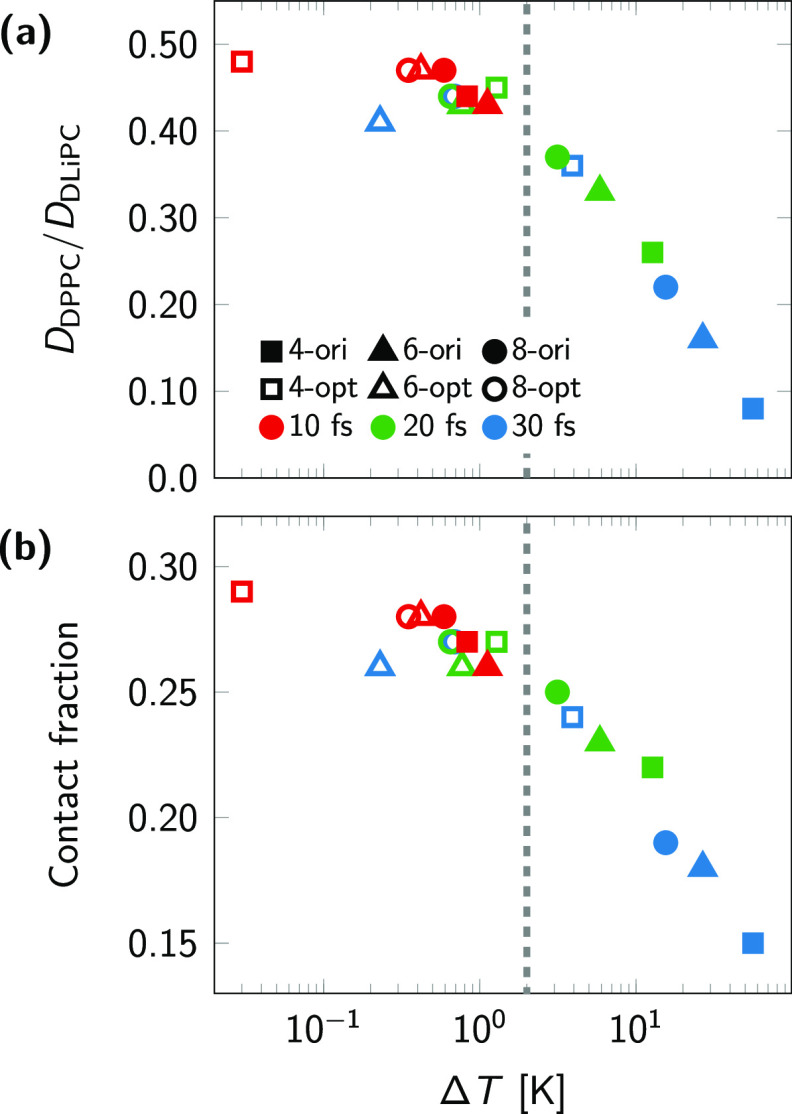
Figure 4.
Effect of artificial temperature gradient in the membrane on its dynamic and static properties. (a) Ratio of the lateral diffusion coefficients of DPPC and DLiPC lipids. (b) Lipid–lipid contact fraction. Both quantities are shown as a function of the observed temperature difference ΔT of DLiPC and DPPC lipids in the respective systems. LINCS settings and time steps are indicated (see legend in a). Filled and empty symbols correspond to the original and optimized models, respectively, while colors red, green, and blue indicate the time step size. The vertical dashed line indicates the value of ΔT = 2 K, below which both observables appear to be ΔT independent within statistical uncertainties.

