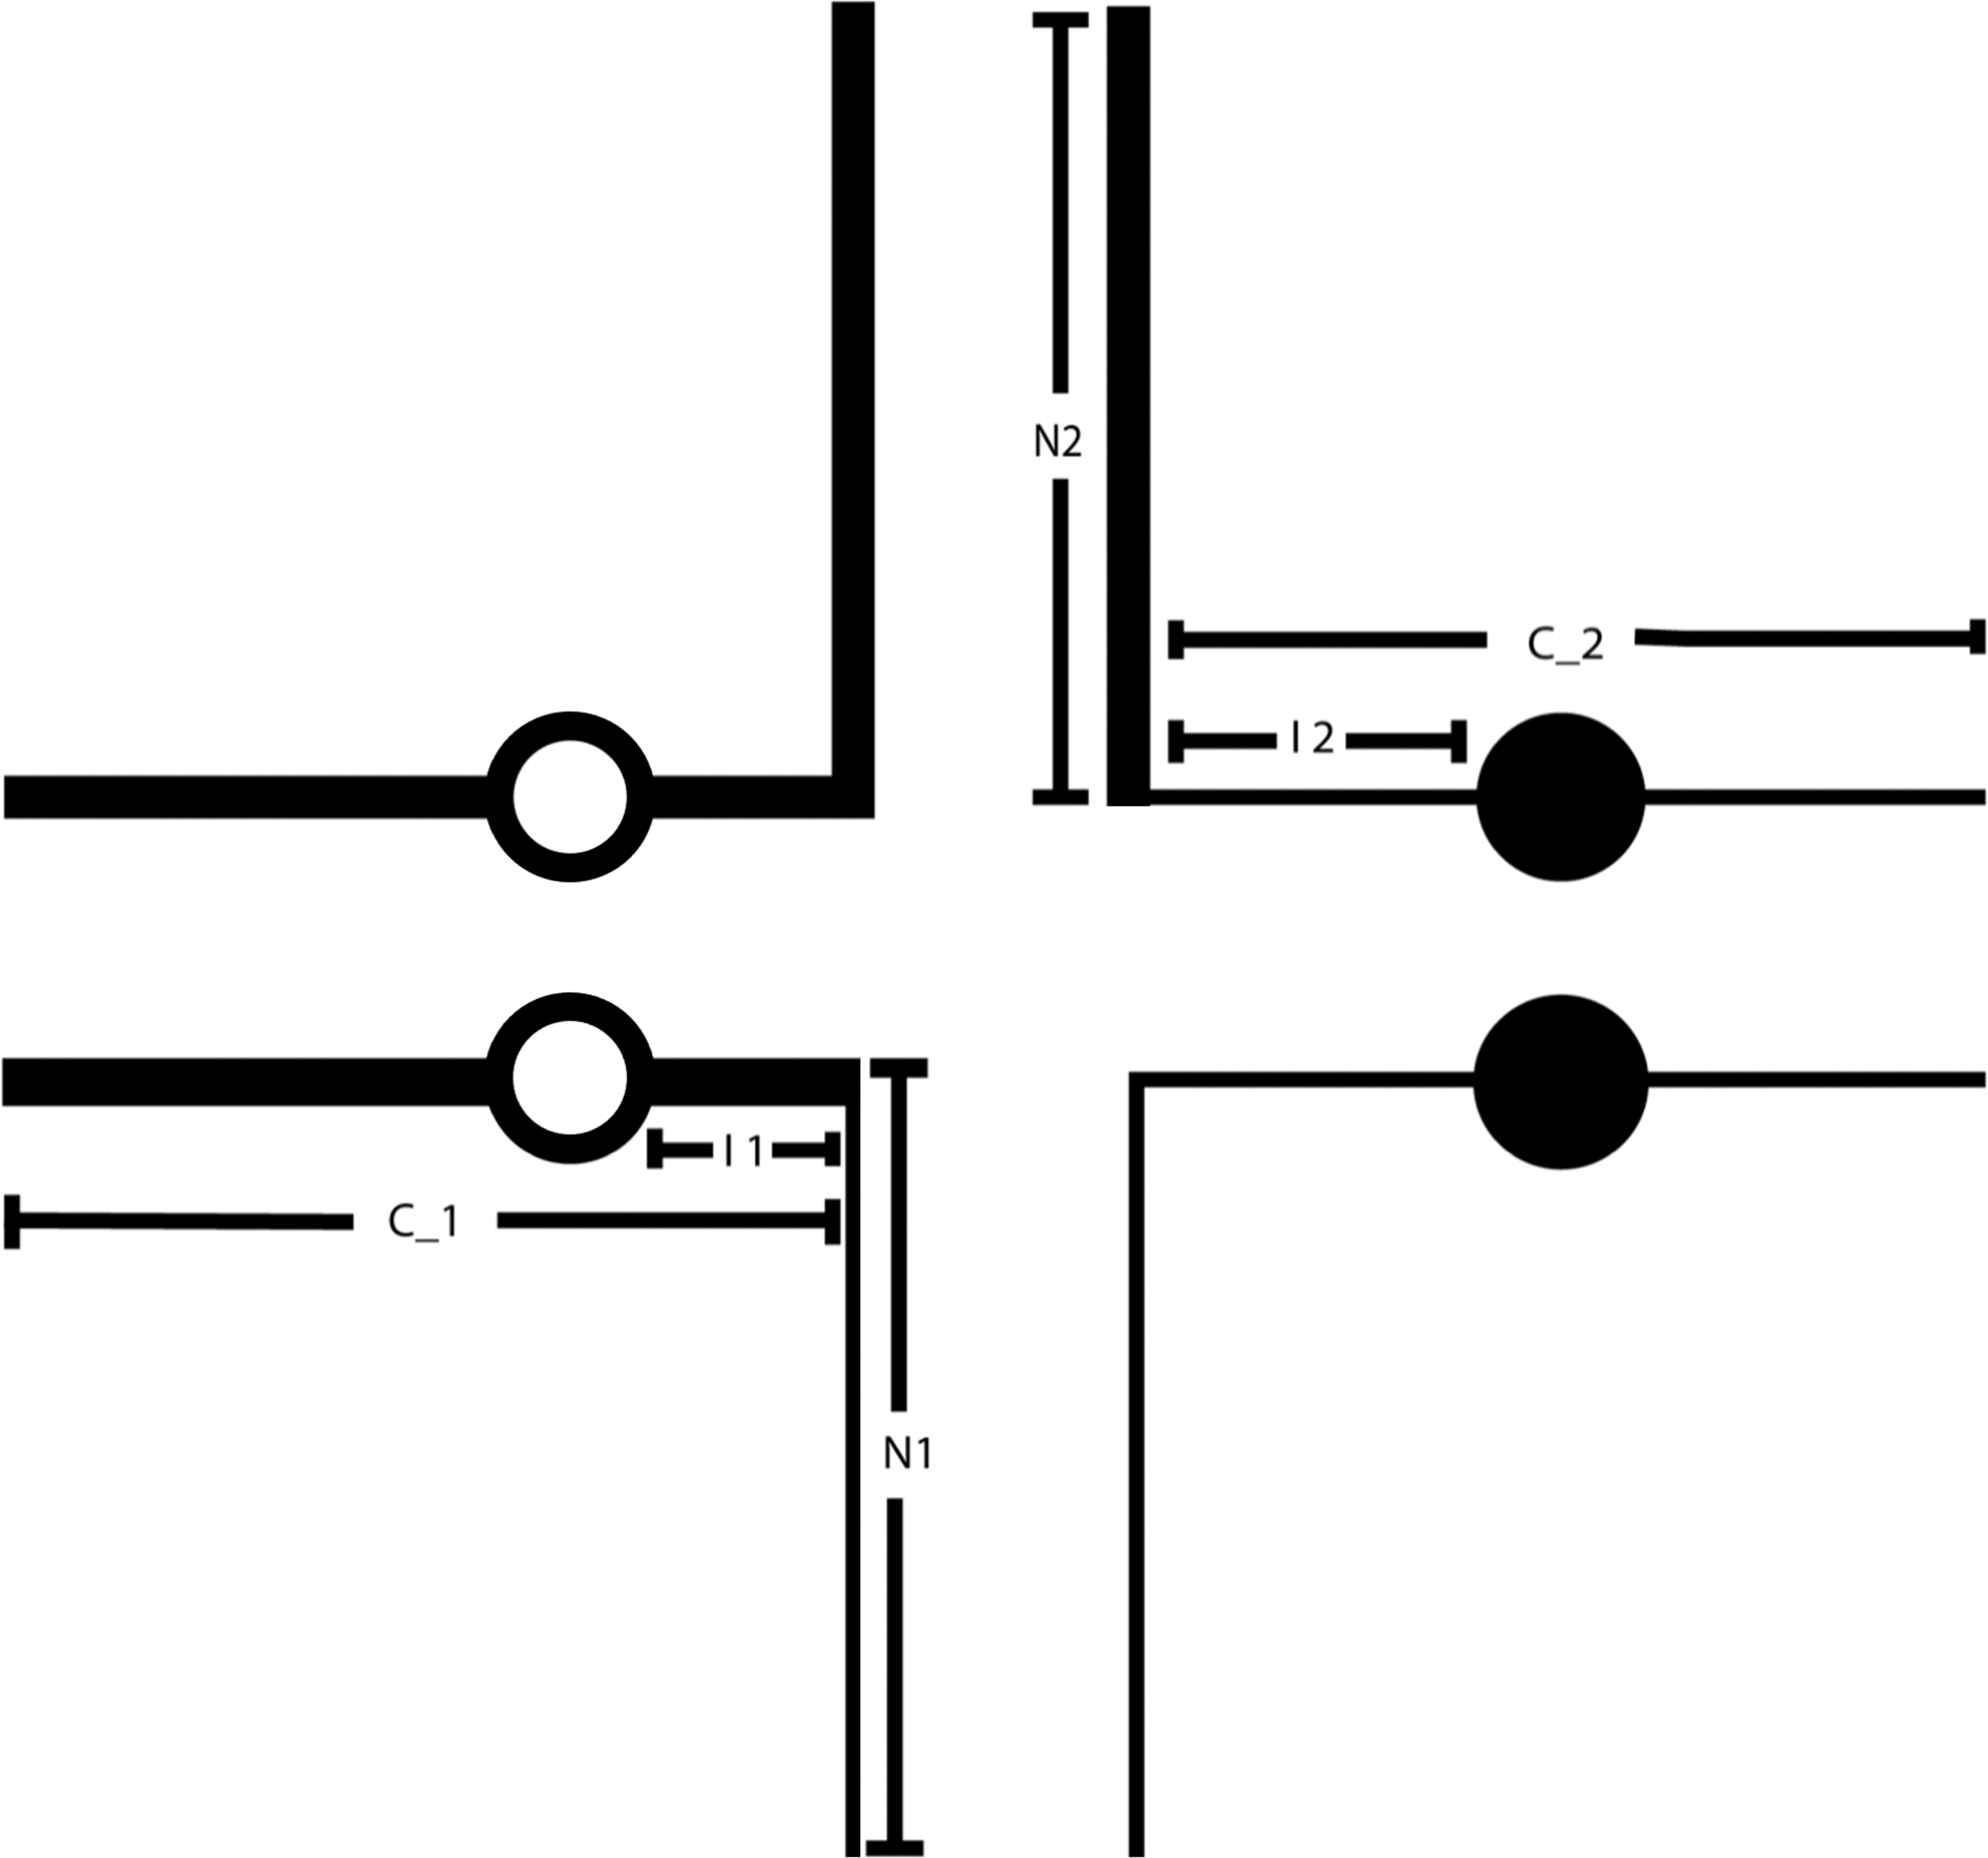
Figure 1.

A pachytene diagram of a balanced translocation on which the N1 and N2 lengths (the distances from the breakpoint to the end of the arm in which the break occurred), C_1 and C_2 lengths (the distances from the breakpoint to the end of the other centromere-containing arm), and I1 and I2 lengths (the distances from the breakpoint to the centromere) are indicated. These measurements were used to determine whether the structural characteristics of a reciprocal translocation influence the type of segregation and the viability of the unbalanced segregants. Circles represent the centromeres of the chromosomes involved in the translocation.
