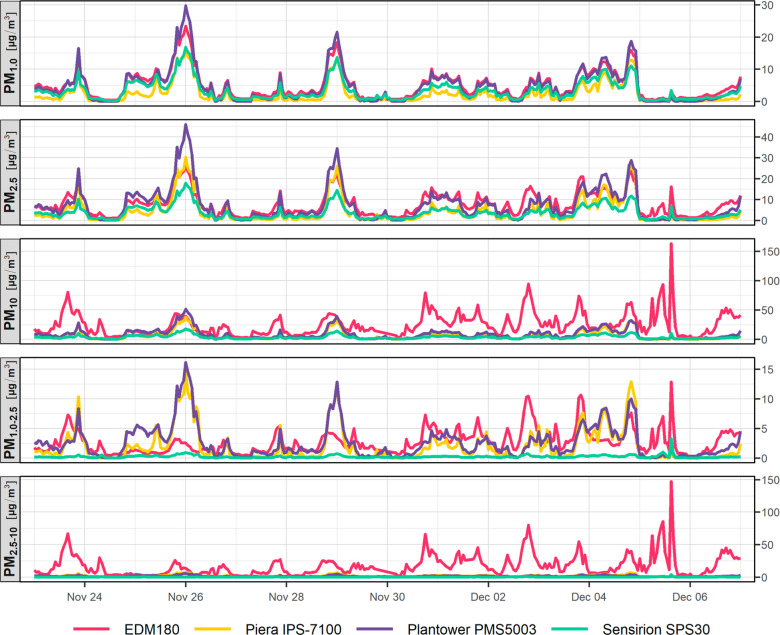
Figure 1.
Time series graph of PM concentrations (cumulative and differential). A subset composed of the first 14 days of the fall/winter period is shown to improve readability. A similar plot for the summer period is available in the SI (Figure S7).

