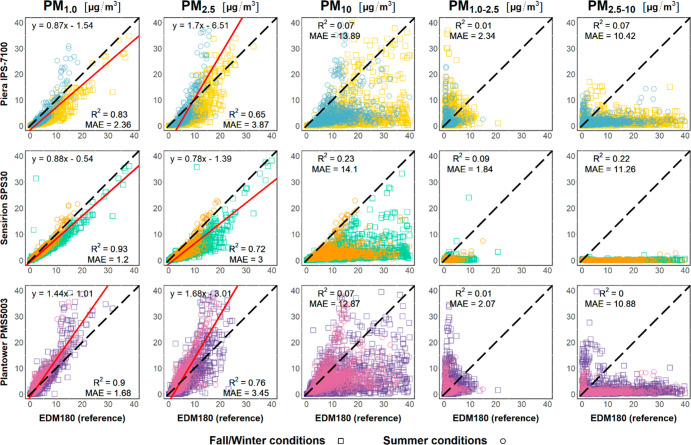
Figure 2.
Regression plots of low-cost sensor PM estimates versus the EDM180 reference measurements. Dashed black lines are identity (1:1) lines, and continuous red lines are the lines of best fit (for models that complied with linear regression assumptions). All the hourly averages (n = 1763) were used to compute the regression models, but some points are not shown in the plots due to the axes ranges.

