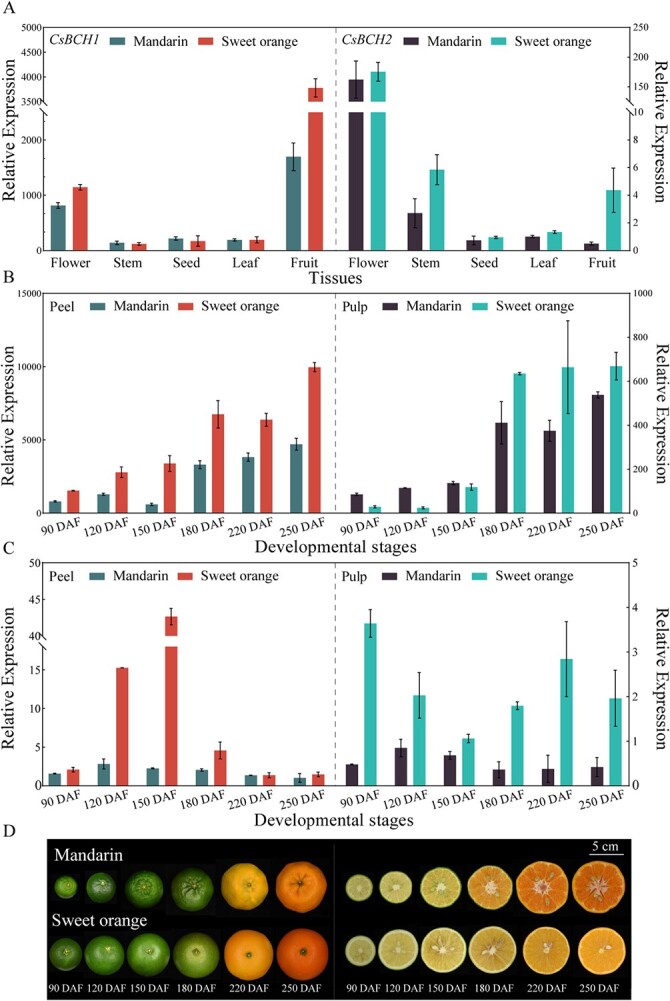
Figure 2.

Expression patterns of CsBCH genes in citrus fruit. (A) CsBCH gene expression patterns were compared between mandarin (Ponkan) and sweet orange (Hamlin) in different tissues by qRT–PCR. (B, C) Relative expression levels of CsBCH1 (B) and CsBCH2 (C) at six development stages of citrus peel and pulp. (D) Phenotype of fruit at six development stages. DAF, days after flowering. Data are mean ± standard error of triplicate samples. Scale bar = 5 cm.
