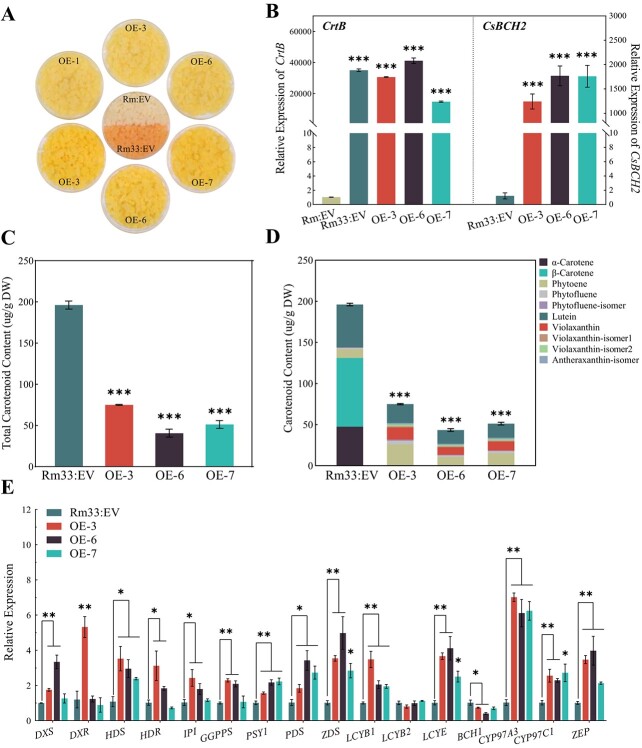
Figure 5.
Carotenoid accumulation and carotenogenic gene expression levels in CsBCH2-overexpressing transgenic lines of callus Rm33. (A) Phenotypes of transgenic line callus Rm (upper part) and Rm33 (lower part). (B) Relative expression levels of CrtB (left) and CsBCH2 (right) in transgenic lines. (C) Total carotenoid content in transgenic lines. (D) Composition and content of carotenoids in transgenic lines. (E) Expression levels of carotenogenic genes in transgenic lines. Data are expressed as mean ± standard error for triplicate samples. Asterisks above the bars indicate statistically significant differences compared with EV (Student’s t-test): *P < .05; **P < .01; ***P < .001.

