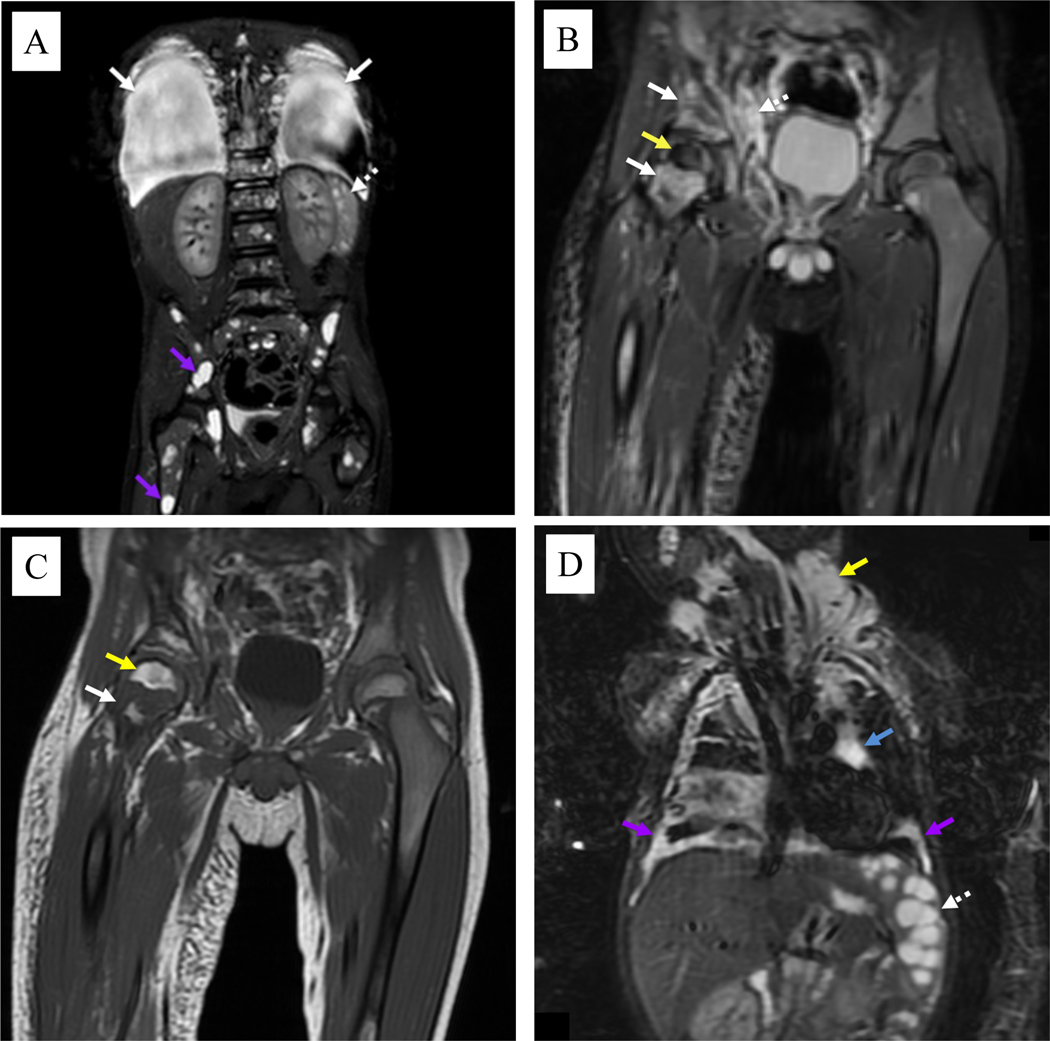
Figure 3.
Coronal magnetic resonance imaging of patients with kaposiform lymphangiomatosis. A) Short-T1 inversion recovery (STIR) image of the body in a 5-year-old male shows large pleural effusions (solid white arrows), multiple small cystic-appearing splenic lesions (dotted white arrows), and numerous cystic-appearing lesions throughout the skeleton (purple arrows). B) STIR image in the same patient shows abnormal confluent foci of increased signal intensity throughout the right pelvis and femoral neck (solid white arrows). There is also abnormally decreased signal intensity throughout the right femoral head (yellow arrow). A more normal pattern of red marrow is seen in most of the left pelvis and femur. Note also the abnormal poorly defined lymphatic tissue in the pelvic soft tissues (dotted white arrow). C) T1 image in the same patient shows intermixed regions of increased signal intensity (yellow arrow) due to increased fat deposition as well as regions of decreased signal intensity (solid white arrow) that are more typical of abnormal lymphatics. D) STIR image in a 10-month-old male shows cystic-appearing splenic lesions (dotted white arrow). Bilateral pleural disease (purple arrows) is noted, as well as mediastinal (blue arrow) and neck (yellow arrow) lymphatic malformations.

