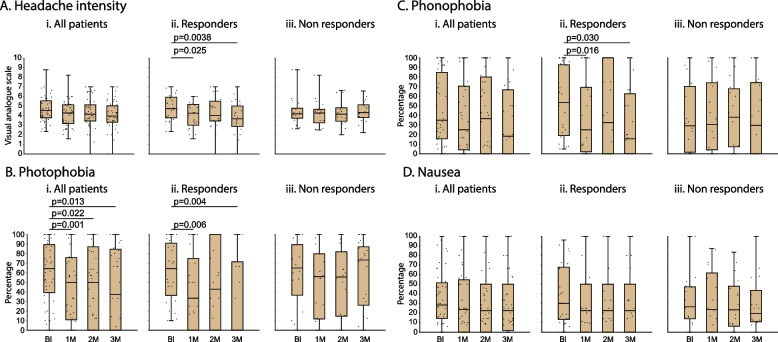
Fig. 5.
Headache intensity (A) and incidences of photophobia (B), phonophobia (C), and nausea (D) during migraine attacks. Box-and-whisker plots (median [IQR]) combined with scatterplots of individual values are illustrated for each of the 4 periods (baseline and during the 3 months treatment). Note that in spite of the decrease in migraine days per month (Fig. 4), the remaining post-treatment attacks were mostly migraineous as indicated by the headache intensity and continuous presence of photophobia, phonophobia and nausea. Abbreviations: Bl - baseline, 1M - 1 month, 2M - 2 month, 3M - 3 month

