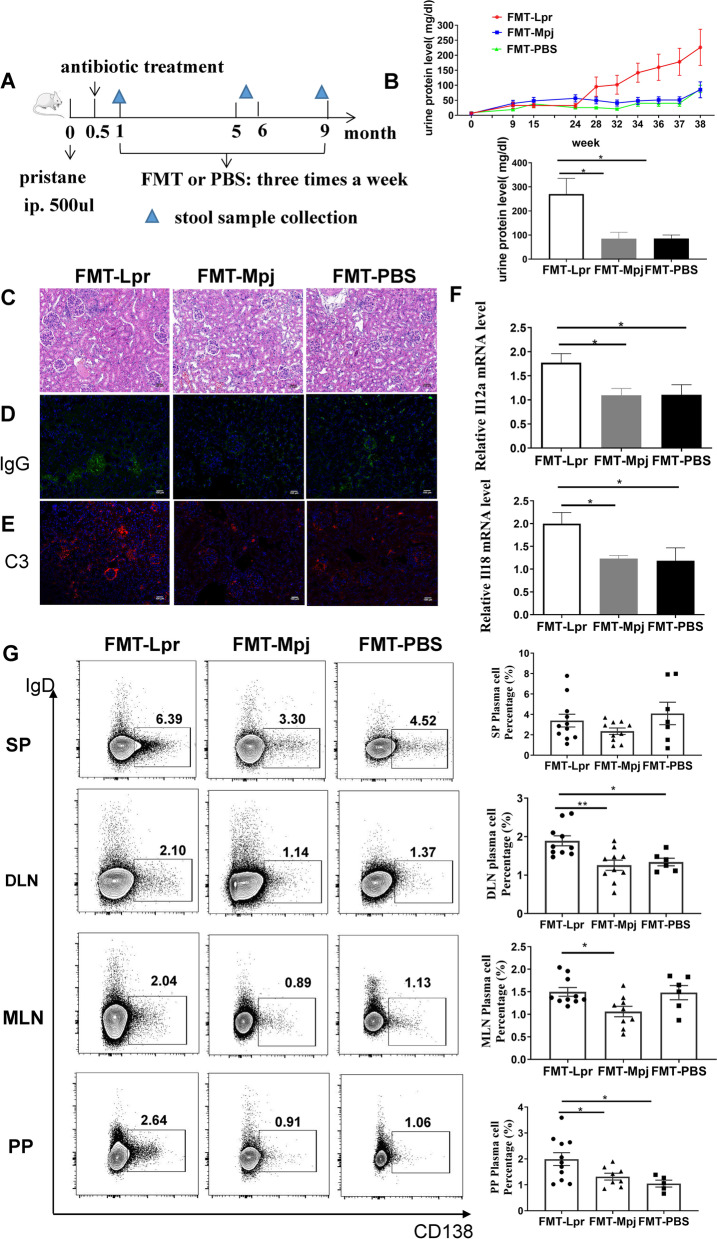
Fig. 1.
FMT-Lpr mice accelerated the lupus pathogenesis. A The schematic timeline of the experiment design. B Dynamic changes of urine protein levels in FMT-Lpr mice, FMT-Mpj mice, and FMT-PBS mice with the disease progression (upper) and urine protein levels measured at the final week of the experiment period (down). C Representative images of HE staining of kidney sections. Representative images of IgG (D) and C3 (E) depositions in the kidney detected by immunofluorescence. Scale bar, 100 μm. magnification × 400. F Il12a, Il18 mRNA expression levels in the kidney. G Flow cytometric analysis of the plasma cell percentages gated on the CD45 + cells in the spleens and lymph nodes (SP: spleen; DLN: draining lymph node; MLN: mesentery lymph nodes; PP: peyer’s patch). *p < 0.05. FMT-Lpr, n = 10 ~ 11; FMT-Mpj, n = 9 ~ 10; FMT-PBS, n = 6 ~ 7

