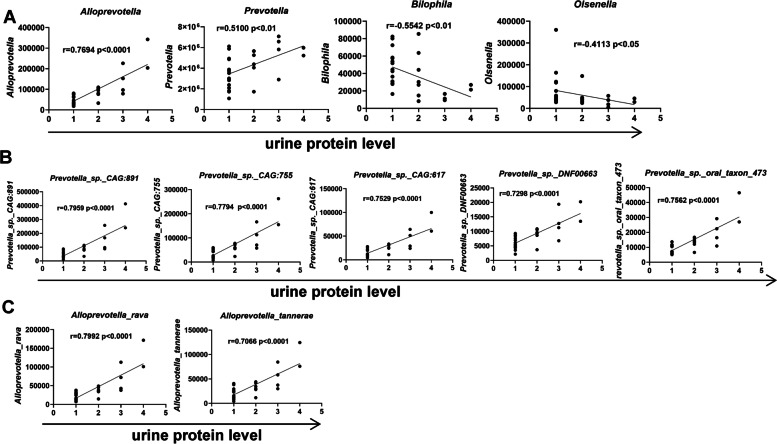
Fig. 7.
The associations between the urine protein levels and the abundances of characteristic taxa. A The association of the abundances of prevotella, alloprevotella, bilophila, and oslenella with the urine protein levels. B The association of the abundances of the specific prevotella taxa with the urine protein levels (correlation coefficient values > 0.7 are shown). C The association of the abundances of the specific alloprevotella taxa with the urine protein levels (correlation coefficient values > 0.7 are shown). Spearman’s rank correlation coefficient, r-values, and p-values are shown. FMT-Lpr, n = 11; FMT-Mpj, n = 10; FMT-PBS, n = 7

