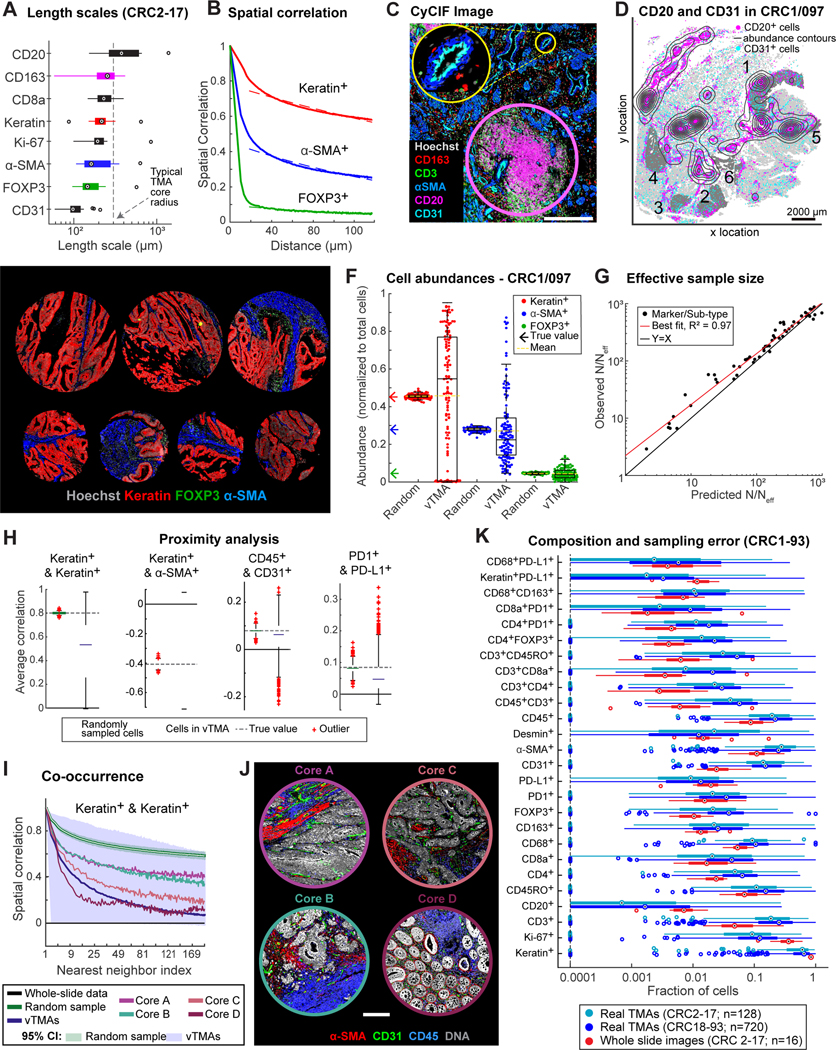
Figure 2. Spatial heterogeneity and estimation errors for regional sampling.
(A) Length scales for select markers across CRC1–17. (B) Spatial correlations of binarized staining intensities for CK+ (red), α-SMA+ (blue), and FOXP3+ (green) cells, and exponential fits. (C) CyCIF image showing CD20+ TLS (pink circle) and CD31+ blood vessel (yellow circle). (D) Spatial distribution of CD20+ cells (magenta dots, contours) and CD31+ cells (cyan dots); #1–6: annotated ROIs. (E) Virtual TMA cores from CRC1/097 and real TMA cores from CRC2–93. (F) Cell-type abundance estimates using vTMA cores or random sampling. (G) Estimation error of vTMAs summarized by fold-reduction in effective sample size, N/Neff, for marker log-intensities and cell-type compositions. (H) Correlation of select cell-type pairs amongst 10 nearest neighbors (I) Correlation functions of CK+ cells, estimated from vTMAs or random sampling. Estimates from four cores also shown. (J) Images of cores highlighted in (I). (K) Fraction of marker-positive cells across CRC2–17 whole-slide or TMA data, or TMAs from CRC18–93. Box plot displays data points and 1st-3rd quartiles, whiskers extend at most to 1.5x interquartile range, and proportions <0.0001 are denoted as a single data point along dotted line. Outliers labeled as crosses (F&H) or circles (A&K); medians are indicated.

