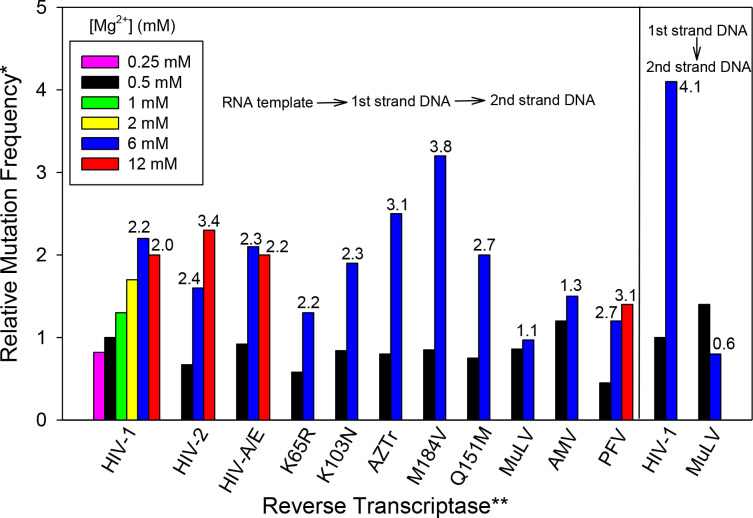
Fig. 2.
Relative fidelity of various reverse transcriptases (RT) in different Mg2+ concentrations. The α-complementation assay (see Methods) was used to estimate the fidelity of the indicated RT with different concentrations of free Mg2+ (as indicated). The value for HIV-1 wild-type (HXB2 clone) at 0.5 mM Mg2+, after background subtraction, was set to “1” (see below) and higher values indicate a higher mutation frequency. Assays conducted with the RNA template, which go through two rounds of RT DNA synthesis, are shown on the left while those using the single round DNA templated assay are on the right. Data used to construct this graph is shown in Table S1. *Relative mutation frequency was based on the colony mutation frequency and was calculated from the proportion of bacterial colonies that were white or faint blue in the α-complementation assay divided by the total number of colonies (i.e.: (white colonies + faint blue colonies) /(white colonies + faint blue colonies + blue colonies)). The background value (see Methods) was subtracted from each condition to get the final value for comparisons. All values represented by colored bars are relative to the value for HIV-1 RT at 0.5 mM Mg2+ which was set to 1. **Numbers above 6 and 12 mM Mg2+ conditions are the fold difference between that value and the value for the same reverse transcriptase at 0.5 mM Mg2+. All fold changes represent the minimum fold change and actual fold changes are likely higher (see Results). ***Reverse transcriptases with amino acid changes are drug-resistant forms of HIV-1 RT; AZTr: D67N/K70R/T215F/K219Q.

