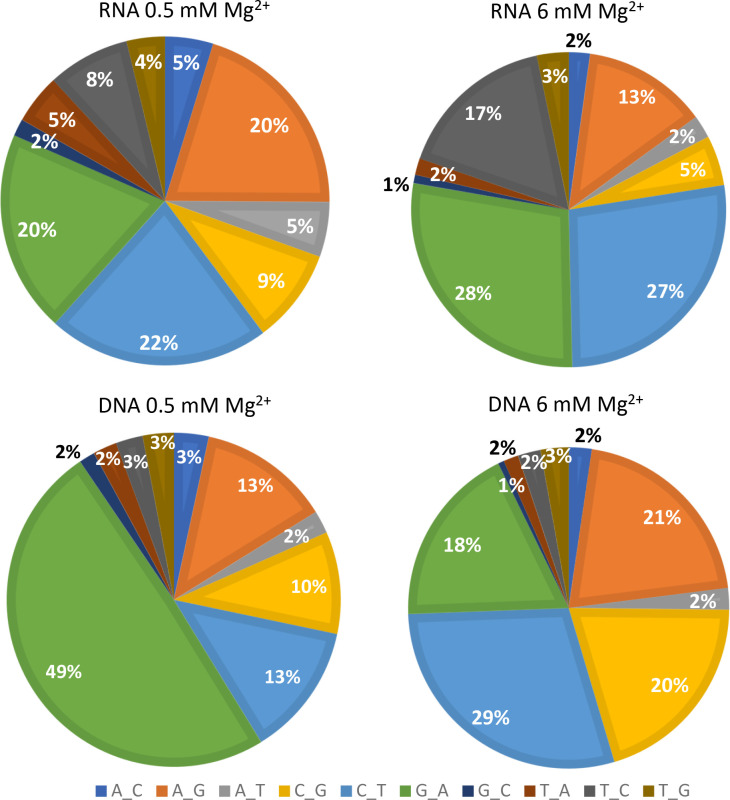
Fig. 3.
Proportion of various substitution mutations in the NGS assay (Exp. 1). The proportions of substitution mutations recovered using the indicated conditions in the NGS assay are shown.G>T and C>A mutations are excluded from the analysis (see Results). See Table 1 for more information on the mutation rates for the various mutations.

