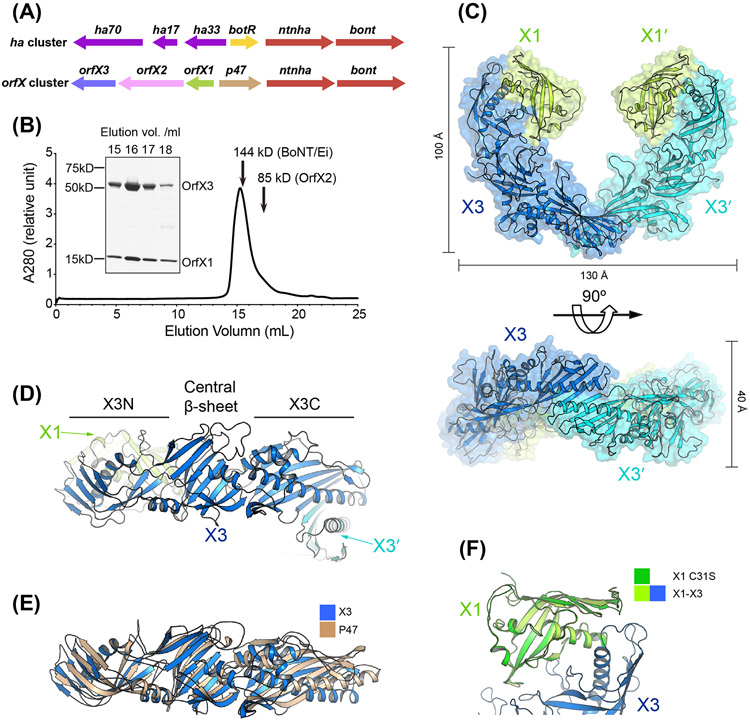
Figure 1. Crystal structure of the tetrameric OrfX1–OrfX3 complex.
(A) Composition of the ha and orfX neurotoxin gene clusters. (B) SEC analysis of the recombinant OrfX1–OrfX3 complex (~142 kDa) (n=3, a representative result is shown). The 144 kDa catalytically inactivated BoNT/Ei and 85 kDa OrfX2 were used as molecular weight references and their peaks were indicated by arrows. The purity of the selected peak fractions was examined by SDS-PAGE. (C) Ribbon and surface representations of the OrfX1–OrfX3 complex in two different views. The two OrfX1 molecules are colored in lime green, while the two OrfX3 are colored in blue and cyan, respectively. (D) Ribbon representation of OrfX3 that has two TULIP-like domains (X3N and X3C) connected by a central β-sheet. (E) Structural superimposition of OrfX3 and P47. (F) Structure superimposition of OrfX1C31S into the WT OrfX1 in the OrfX1–OrfX3 complex.

