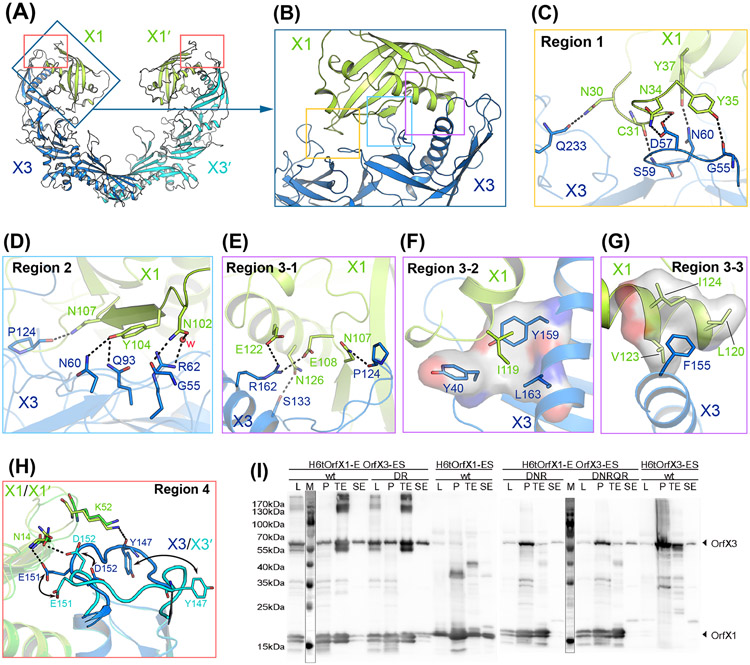
Figure 2. Interactions between OrfX1 and OrfX3.
(A) Overall structure of the OrfX1–OrfX3 complex. (B) Close-up view of the OrfX1–OrfX3 heterodimer interface with the three major interacting areas highlighted in boxes. (C-G) Stick representations of key interacting residues at the OrfX1–OrfX3 interface. Hydrogen bonds are shown as dashed lines and hydrophobic interactions are shown as surface models. (H) The E144–D153 loop in the two OrfX3 molecules in the context of the OrfX1–OrfX3 complex, colored blue and cyan, displays different conformations. (I) Co-expression analysis of the WT H6tOrfX1-ES, WT H6tOrfX3-ES, H6tOrfX1-OrfX3-ES WT complex and the respective OrfX3 mutants D152R/R162A (DR), D57A/N60A/R62A (DNR), and D57A/N60A/R62A/Q93A/R162A (DNRQR) (n=2-4). L, clear lysate; P, cell pellet after lysis; TE, eluate from Co2+-Talon matrix; SE, eluate from StrepTactin matrix. Samples were analyzed by immunoblot using anti-OrfX1-3 specific polyclonal rabbit IgG KOrf154. The corresponding SDS-PAGE and Coomassie staining result is shown in Fig. S2.

