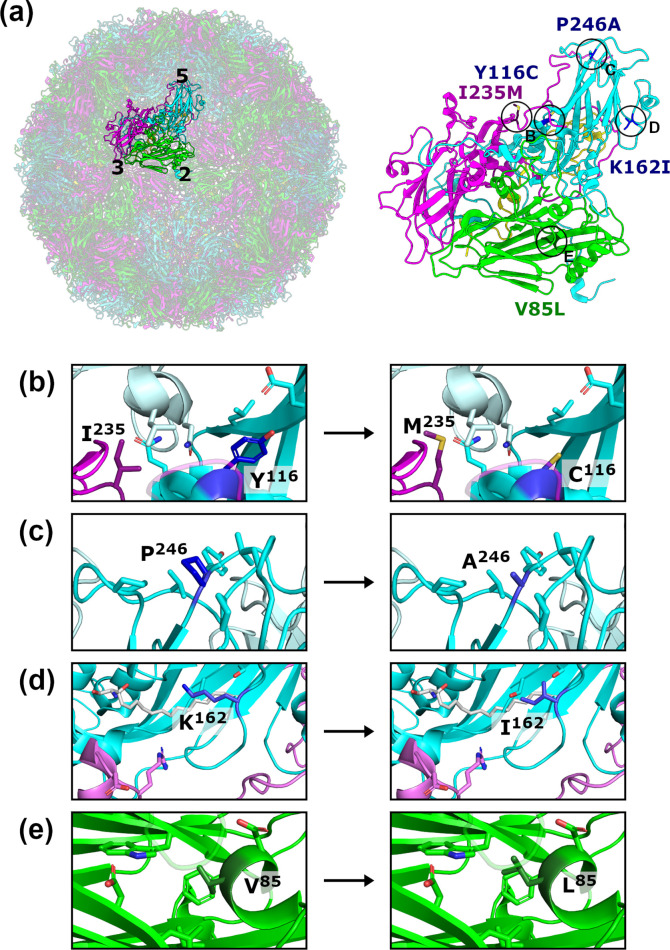
Fig. 2.
Location of mutations in the stabilized virus population. (a) A single protomer highlighted within the context of the full EVA71 capsid (left; PDB: 3VBS, [30]), with icosahedral axes indicated (5, fivefold; 3, threefold; 2, twofold). The protomer is shown in an expanded view (right) with the sites of mutations indicated. VP1, cyan; VP2, green; VP3, magenta; VP4, yellow. (b–e) Expanded views showing the sites of mutation indicated in (a), with selected side chains shown. Adjacent protomers are indicated by pale colours. In some cases, segments of the backbone were removed or made partially transparent to improve clarity.

