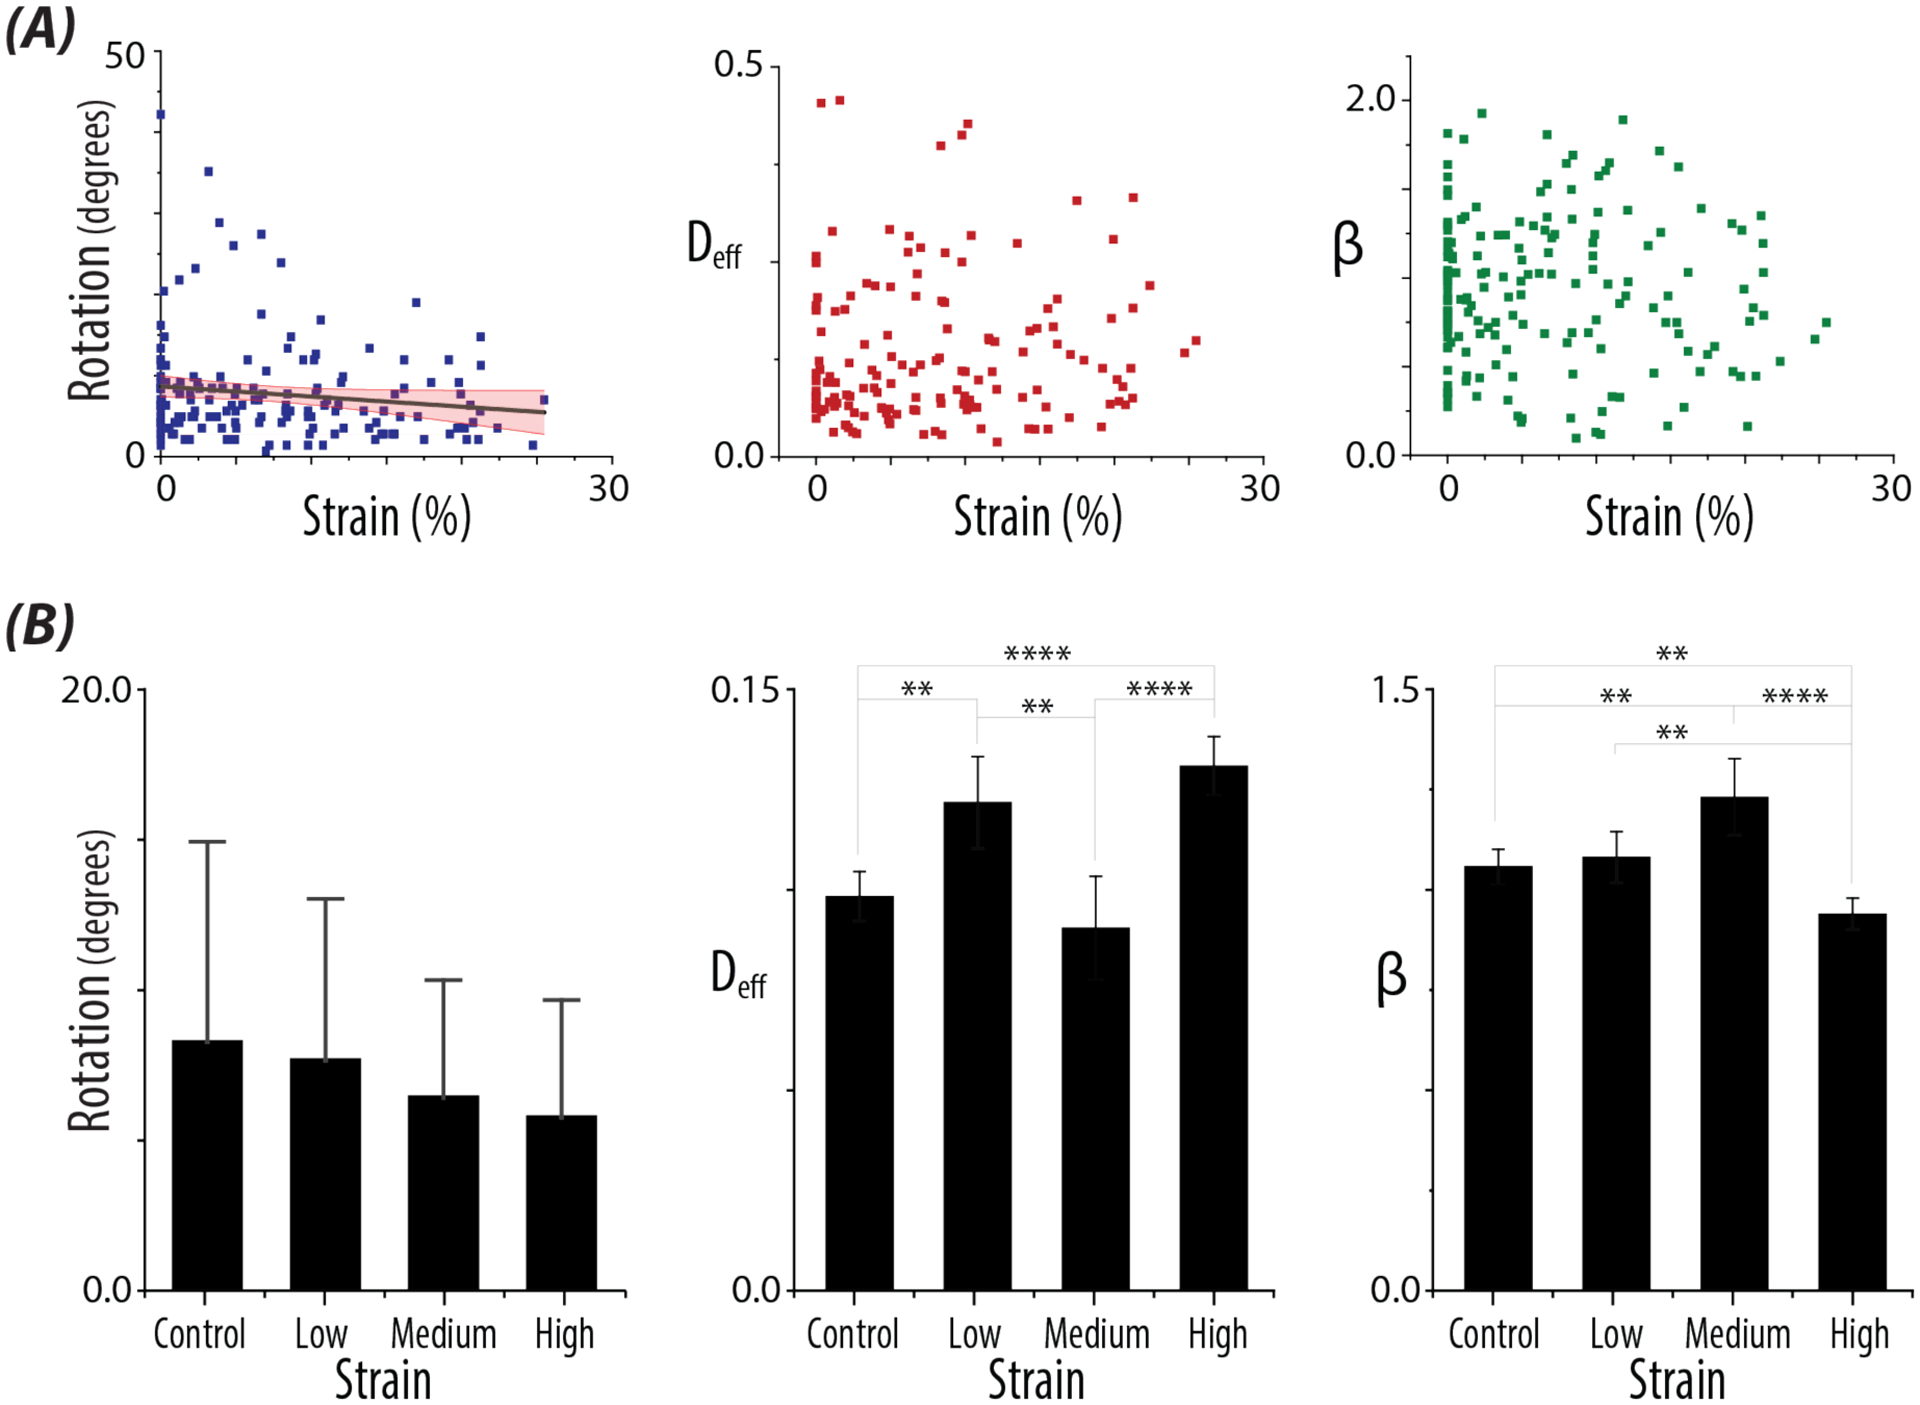
Figure 3: A single high impulse load alters nuclear rotation and intranuclear movement.

A) Quantified values of nuclear behavior. Plots show the quantified values of Rotation (p=0.03), and the derived parameters, Deff and β, with continuous models of the experienced strain magnitudes. Confidence interval of the fitted line (95%) in red. Control nuclei are represented in the plots as having 0% strain. B) Bar plots of Rotation, Deff, and β for control nuclei, nuclei which received Low (0–2%), Medium (9–15%), and High (>18%) strain. Errors bars represent SD for Rotation. Error bars represent 95% confidence intervals for Deff and the β. n > 17 nuclei/strain level, N >5 animals. Bonferroni adjusted p-values :*p < 0.008833, ** p < 0.0017, *** p < 0.00017, **** p <0.000017.
