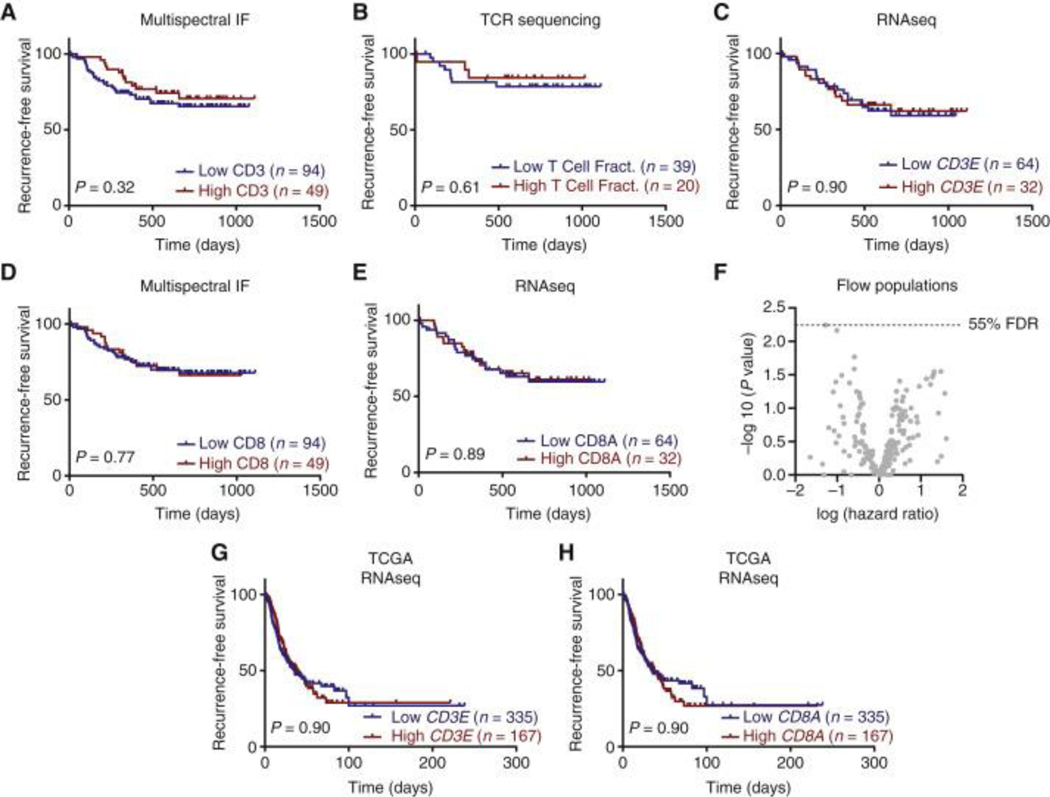
Figure 3. Tumor-infiltrating T-lymphocyte infiltration and individual subpopulations cannot predict survival.
(A-E) Kaplan–Meier curves and log-rank P values showing recurrence-free survival for non-small-cell lung cancer patients with high (upper tertile, red) and low levels (lower two tertiles, blue) of (A) CD3 T cells (cells/mm2) defined by multiplex immunofluorescence (mIF). (B) T-cell fraction defined by ImmunoSeq. (C) CD3E transcript defined by RNA Sequencing. (D) CD8 T cells (cells/mm2) defined by mIF. (E) CD8A transcript defined by RNA Sequencing. (F) Volcano plot showing hazard ratios for all immune populations determined by flow cytometry using Cox proportional hazards model considering stage as a covariate. Benjamini–Hochberg procedure used to correct for multiple comparisons. (G, H) Survival in The Cancer Genome Atlas (TGCA) patients based on CD3E (G) and CD8A (H) transcript levels split into high (upper tertile, red) and low (lower two tertiles, blue). Log-rank test was used to determine significance.
FDR, false discovery rate.

