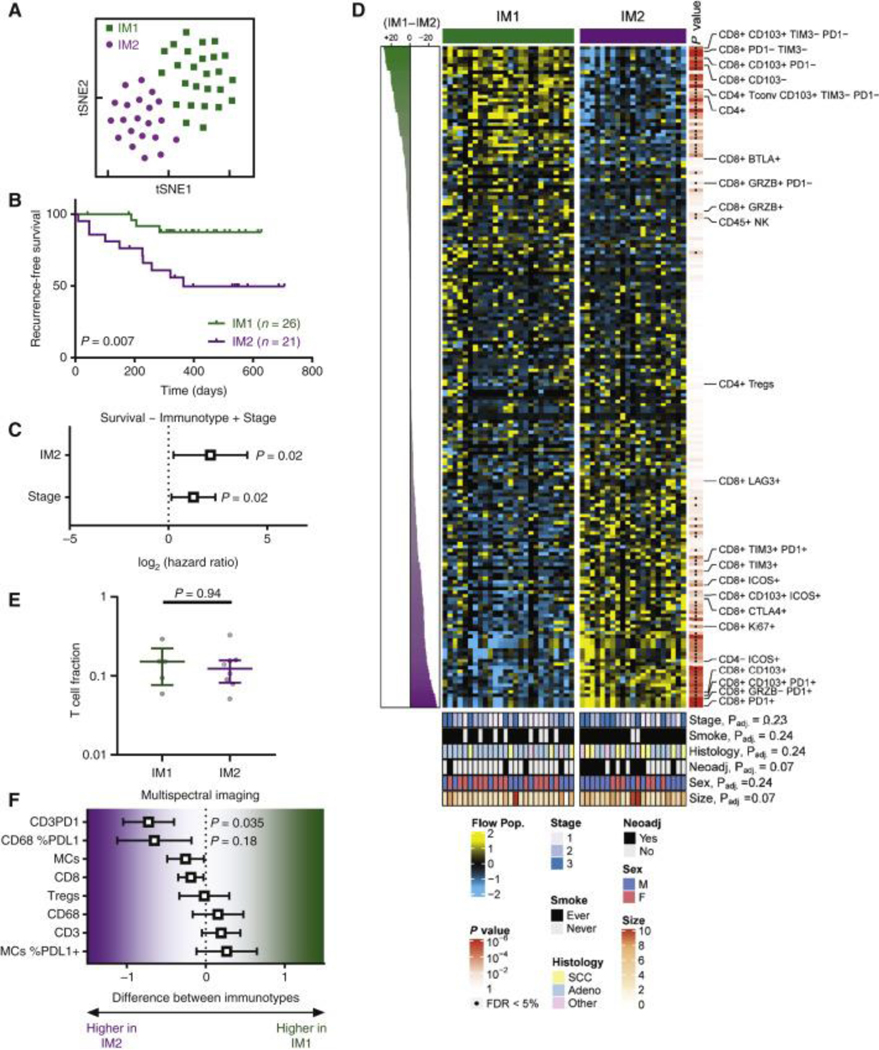
Figure 4. Immunotype determined by tumor-infiltrating T lymphocyte composition is prognostic in non-small-cell lung cancer (NSCLC).

(A) tSNE showed that tumors from NSCLC patients (n = 47) could be assigned to two major immunotypes (IM1 and IM2). (B) Kaplan–Meier curves showing recurrence-free survival (RFS) in IM1 (green, n = 26) and IM2 (purple, n = 21) tumors. (C) Multivariate Cox proportional hazards model for RFS based on immunotype and tumor stage. (D) Heat map showing all immune populations measured by flow cytometry, with significance indicated to the right of the heat map and clinical parameters indicated at the bottom of the heat map. (E) T-cell fraction determined by immunoSEQ in IM1 and IM2 patients. Median with interquartile range. Rank-sum P value is shown. (F) Malignant cells (MCs), CD8, regulatory T cells (CD3+CD8−Foxp3+), CD68 (macrophages), CD3, CD3PD1, CD68 %PDL1, and MCs %PDL1 expression were analyzed using multiplex immunofluorescence in IM1 and IM2 patients. Values are shown as mean difference with 95% confidence interval.
PD-1, programmed cell death protein 1; PD-L1, programmed death-ligand 1; Tregs, regulatory T cells.
