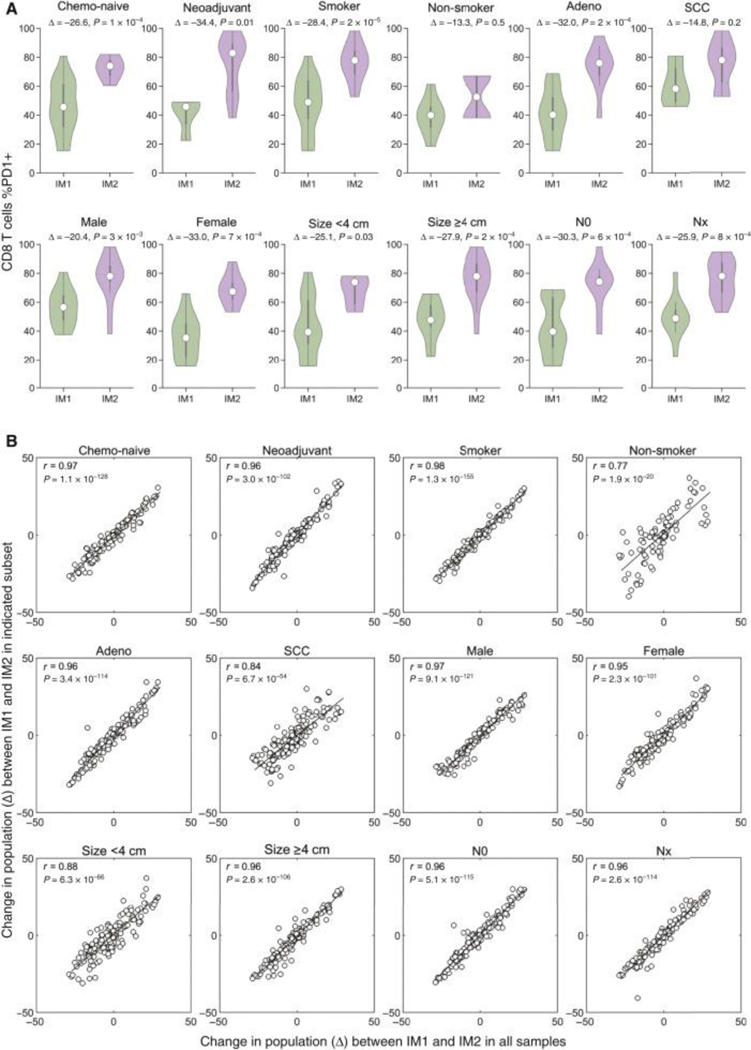
Figure 5. Immunotype changes are conserved across different patient subsets.
(A) Comparison of percentage of CD8 T cells positive for PD1 between IM1 and IM2 in indicated subsets of patients. White dot indicates median value, Δ indicates difference in %PD1+ CD8+ T cells between groups. Rank-sum test. (B) Plots comparing the difference (Δ) in all immune cell populations between IM1 and IM2 observed in the entire set of patients analyzed (x-axis) and to the difference observed in indicated subsets of patients (y-axis). Pearson correlation coefficient (r) and corresponding P value (inset).
N0, no evidence of regional node involvement; NX, any evidence of lymph node involvement; SCC, squamous cell carcinoma.

