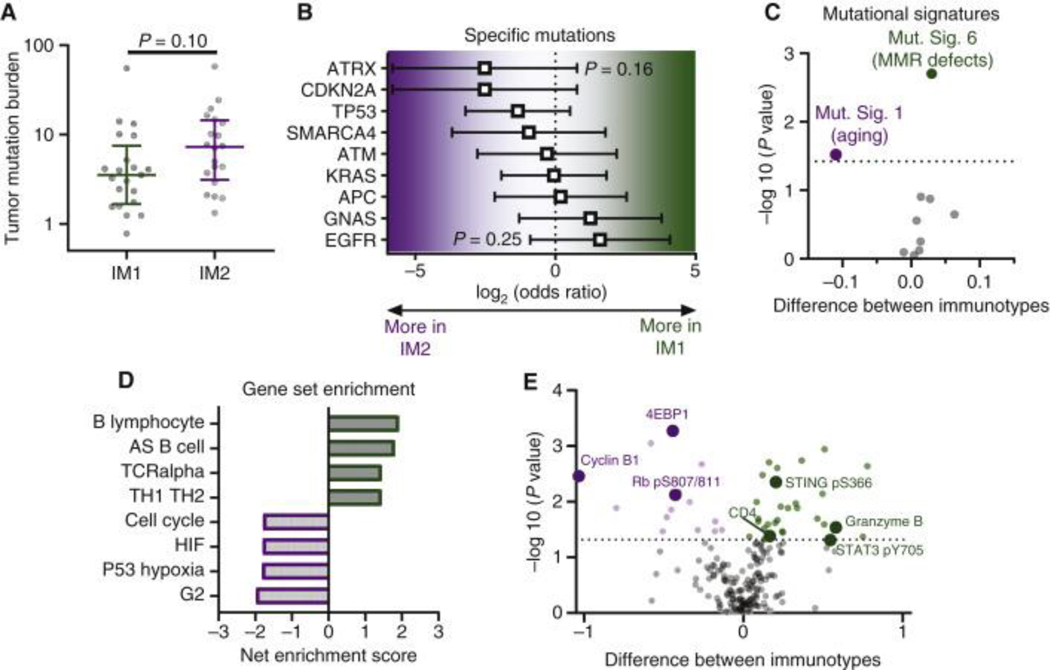
Figure 6. Molecular characterization of IM1 versus IM2 in the ICON cohort.
(A) Tumor mutation burden in IM1 (n = 21) and IM2 (n = 20) tumors. Median with interquartile range and P value by rank-sum test. (B) Comparison of mutation frequency for specific genes between IM1 (n = 21) and IM2 (n = 20) by Fisher’s exact test. Odds ratio shown with 95% confidence interval. (C) Volcano plot showing difference in various mutational signatures between IM1 (n = 21) and IM2 (n = 20) tumors. Rank-sum test with Benjamini–Hochberg false discovery rate (FDR). Dotted line indicates 10% FDR. (D) Gene set enrichment analysis of differential gene expression between IM1 (n = 15) and IM2 (n = 13) tumors. Pathways enriched in IM1 have positive scores and pathways enriched in IM2 have negative scores. (E) Volcano plot showing proteins differentially expressed between IM1 (n = 24) and IM2 (n = 21) tumors. Rank-sum test with Benjamini–Hochberg FDR. Dotted line indicates 10% FDR.
MMR, mismatch repair.

