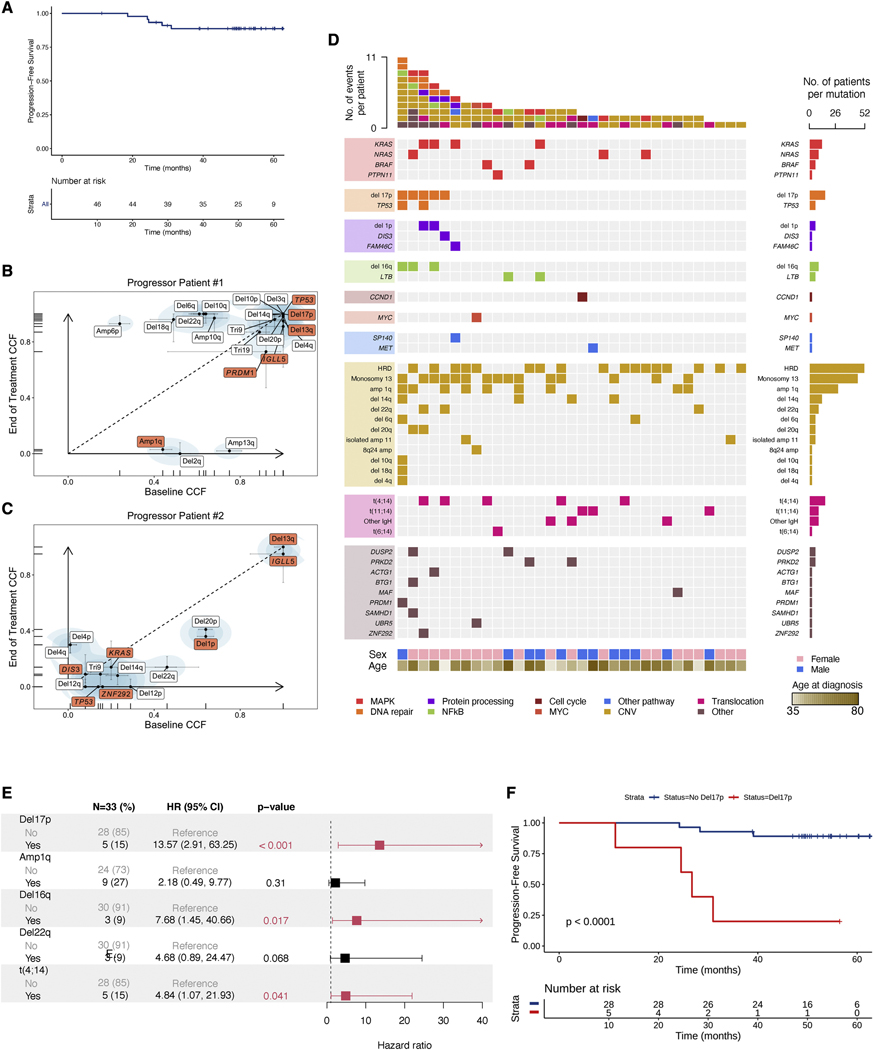
Figure 1.
Genomic dissection of response to early treatment with EloLenDex. A) Kaplan-Meier (KM) curve of Progression-Free Survival (PFS) in the E-PRISM cohort (n=46). B, C) Scatter plot of cancer cell fractions (CCF) at BL and EOT for progressor patients #1 and #2 (in red: mutational drivers and CNVs associated with risk of progression). All CNVs and mutational drivers are visualized. D) Comutation plot visualizing the genomic landscape of the E-PRISM cohort at BL (n=34). E) Univariate Cox regression forest plot of genomic variables present in at least 3 individuals. Hazard ratio, 95% confidence interval, and p-values were computed using Cox proportional hazards regression. F) KM curve of PFS in the E-PRISM cohort, stratified based on the presence of del17p (n=33). See also Figures S1, S2, and Table S1.

