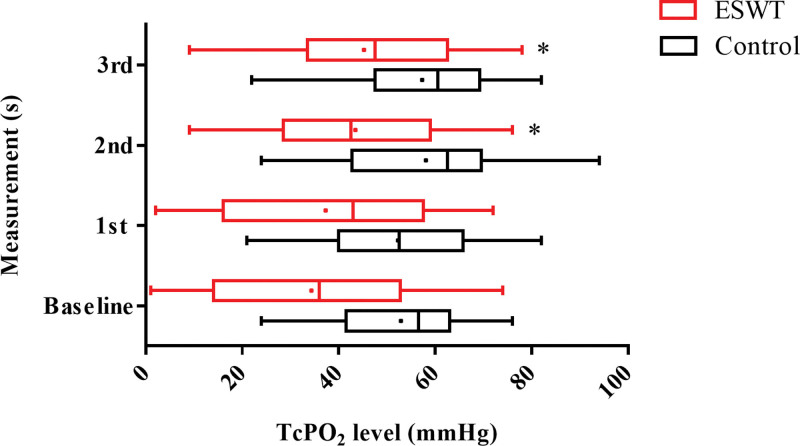
Figure 4.
Serial change of TcPO2 of baseline and follow-up measurements. *P < .05 versus baseline (n = 32). Vertical line in each box represents the median TcPO2. Horizontal lines extending from each box represent the maximum and minimum TcPO2 for each group. The mean value for each group is indicated by a dot. ESWT = extracorporeal shockwave therapy, TcPO2 = transcutaneous partial oxygen pressure.

