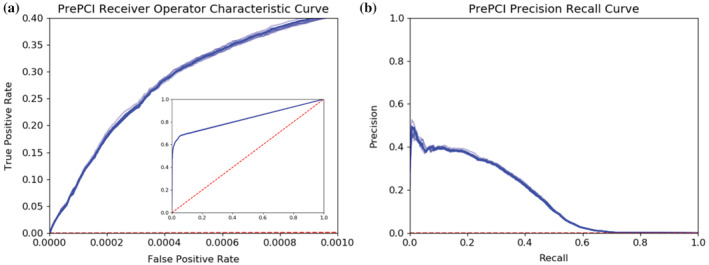
FIGURE 2.

PrePCI performance on unbiased, all‐against‐all experimental protein–compound data from PubChem. (a) Receiver operating characteristic (ROC) curve and (b) Precision Recall curve for each of the 10‐folds of cross‐validation for training and testing PrePCI on experimentally observed PCIs from PubChem. Curves for the median area under the ROC curve (AUROC, a) and average precision (b) across all cross‐validation folds are darker, while curves for remaining folds (lighter blue) are included to display the range of results obtained from the individual folds. PrePCI's average AUROC and Average Precision on the PubChem dataset are 0.828 ± 0.001 and 0.168 ± 0.002, respectively.
