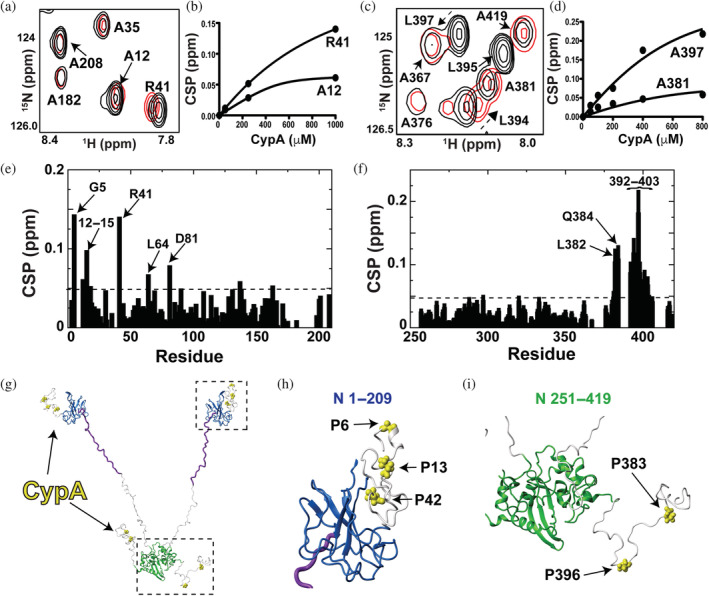
FIGURE 5.

Identifying cyclophilin‐A (CypA) interaction sites within the N protein. Titrations were all conducted on a Varian 900 spectrometer at 35 °C. (a) Section of 15 N‐HSQC spectra of 200 μM 15 N‐labeled N 1–209 alone (black) and the addition of 1.0 mM CypA (red). (b) Binding isotherm for 15 N‐labeled N 1–209 with the addition of CypA. (c) 15 N‐HSQC of 200 μM 15 N‐labeled N 251–419 alone (black) and the addition of 0.8 mM CypA (red). (d) Binding isotherm for 15 N‐labeled N 251–419 with the addition of CypA. (e) Chemical shift comparisons (CSPs) between 15 N‐labeled 1–209 alone and in the presence of CypA with the dashed line (0.048 ppm) delineating the sum of the average CSP (0.025 ppm) plus 1 standard deviation (0.023 ppm). (f) CSPs between 15 N‐labeled 251–419 alone and in the presence of CypA with the dashed line (0.064 ppm) delineating the sum of the average CSP (0.031 ppm) plus 1 standard deviation (0.033 ppm). (g) Prolines within the N protein targeted by CypA are mapped onto a full‐length model of the N protein (yellow bonds). This N protein model comprises the folded N‐terminal domain and C‐terminal domain with the remaining regions built in Chimera (purple is the serine/arginine region and the remaining disordered regions in white). (h) Blow up of the N‐terminal region with CypA‐target sites (yellow bonds). (i) Blow up of the C‐terminal region with CypA‐target sites (yellow bonds).
