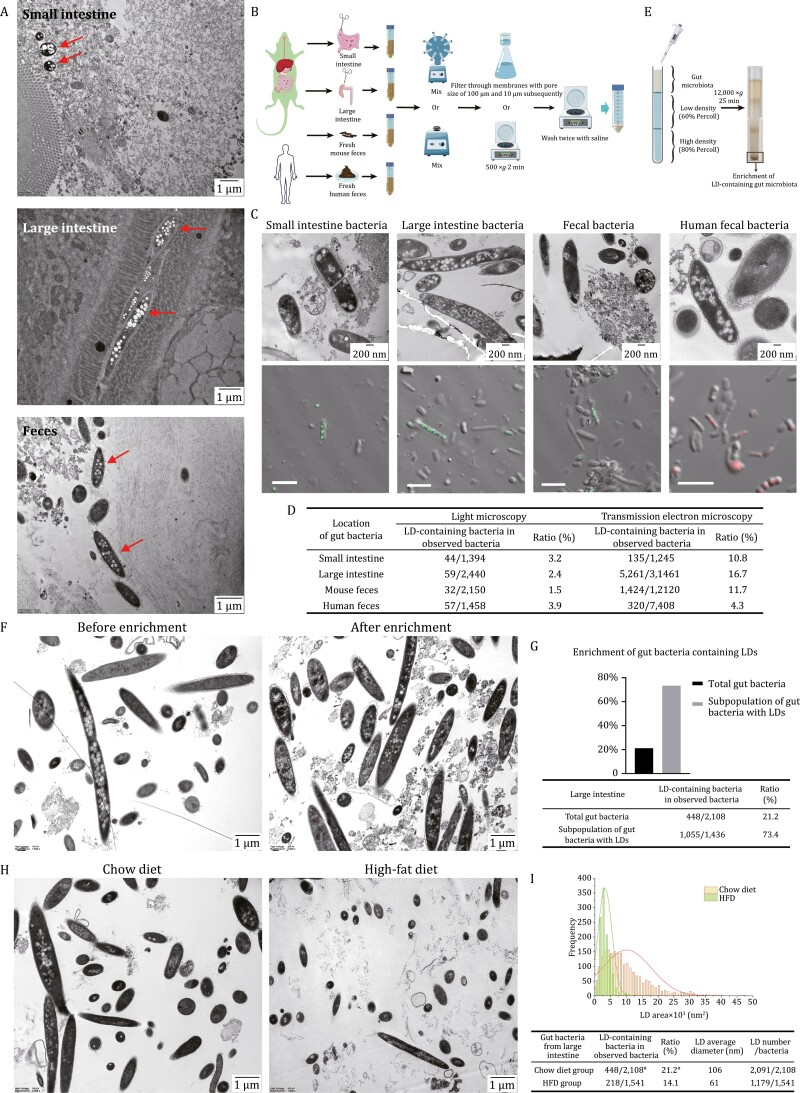
Figure 1.
LDs in gut bacteria. (A) Ultrastructural analysis of mouse intestinal and fecal bacteria in situ by TEM. Briefly, the freshly collected intestine or feces were fixed immediately and embedded in agarose. Then the samples were postfixed in 2% potassium manganate followed by ethanol dehydration and resin embedding. 70 nm ultra-thin sections were transferred onto grids and were stained with uranyl acetate and lead citrate for visualization under TEM. Top, mouse small intestine; middle, mouse large intestine; bottom, mouse feces. Scale bar, 1 µm. (B) The workflow for isolation of microbiota from mouse small intestine, large intestine, mouse and human feces. In brief, mouse small and large intestines and their contents, and the mouse and human fresh feces were collected. Samples were transferred into 50 mL centrifuge tubes and fully mixed in saline by rotation or vortexing. Finally, the samples were filtered or centrifuged to remove food residue, and the bacteria were concentrated and washed two times for use. The illustration used some elements from Servier Medical Art. (C and D) LDs in isolated gut bacteria analyzed by TEM and confocal microscope. (C) Briefly, gut bacteria were isolated freshly from mouse small and large intestines, mouse and human feces, and subjected immediately to sample preparation for TEM and neutral lipid staining. Ultrastructures of the freshly isolated bacteria were presented in upper panel. Briefly, the freshly isolated bacteria were fixed immediately and prepared as ultra-thin sections (70 nm) following dehydration in a series of ethanol, embedding into epoxy resin and sectioning. After staining, the sections were observed under TEM. Scale bar, 200 nm. Neutral lipid staining of fresh gut bacteria were presented in lower panel. Briefly, the isolated bacteria were stained with LipidTOX Green or Red, and imaged by confocal microscope. Scale bar, 5 µm. Then the ratio of LD-containing gut bacteria was calculated as the number of LD-containing bacteria to the number of bacteria counted. (D) 20–50 confocal images for each sample were taken to count the bacteria. All the bacteria in the ultra-sections for each sample were counted in TEM study. (E) The workflow for enrichment of LD-containing gut bacteria. Briefly, after isolation of gut bacteria from mouse large intestine, the bacteria were separated further through Percoll density gradient centrifugation to enrich the subpopulation enriched in LDs. (F and G) Enrichment of LD-containing gut bacteria revealed by TEM. (F) Gut bacteria from mouse large intestine (before enrichment, left panel) and the subpopulation enriched in LDs (after enrichment, right panel), obtained through Percoll density gradient centrifugation, were viewed through TEM. Scale bar, 1 µm. Around 60 TEM images for each group were taken to calculate the ratio of bacteria containing LDs (G). (H and I) LDs in gut bacteria from mice fed chow diet or high-fat diet. Eight-week-old mice given ad libitum access to water and chow diet were randomly divided into two groups of three each. One group was fed chow diet and another high-fat diet (HFD, 60% energy from fat). After 4 weeks, the mice were sacrificed and gut bacteria of large intestine were isolated and viewed by TEM. (H) The representative images of isolated bacteria from mice fed chow diet (left panel) and HFD (right panel) are presented. Scale bar, 1 µm. Around 60 TEM images for each group were taken to calculate the ratio of bacteria containing LDs, and analyze the LD number, size, and area. (I) The LD area, number, and size in gut bacteria of each group were estimated using Imaris v9.8, and a diameter threshold (>15 nm) for LDs was set. # means the data are from (G).

