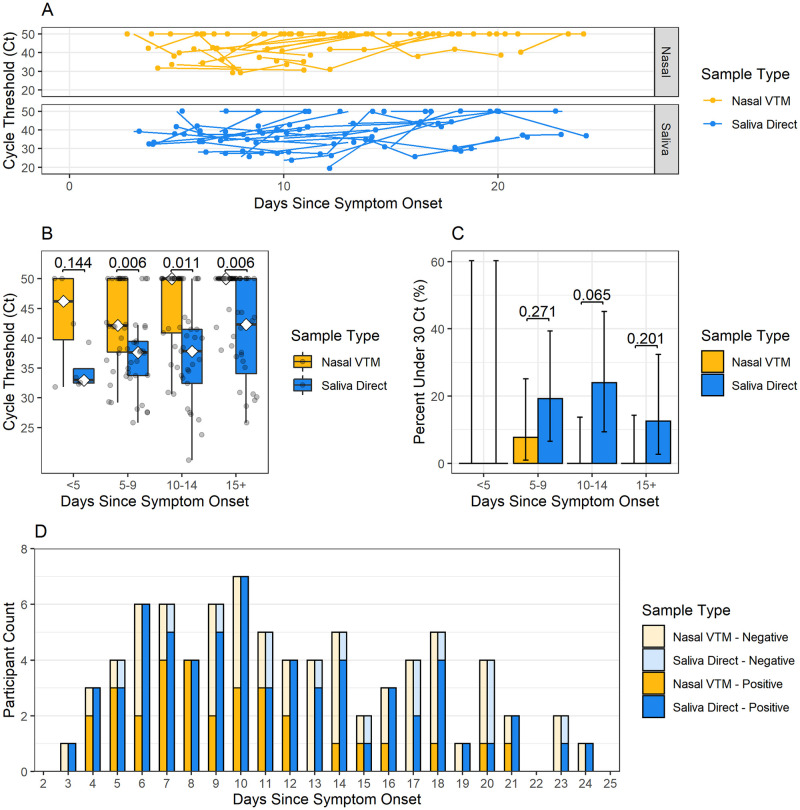
Fig 6. SARS-CoV-2 longevity in longitudinal cohort saliva and nasal specimens.
Analysis of paired specimens in the longitudinal analysis cohort (N = 79 paired observations from 28 patients) by (A) Spaghetti plot of longitudinal Ct values for saliva direct and nasal VTM specimens plotted over time in days since symptom onset. Lines indicate specimens from the same patient. (B) Analysis of paired samples in the longitudinal analysis cohort by patient, (B) Ct values, (C) percent of Ct values under 30, and (D) number of positive and negative test results for saliva direct and nasal VTM specimens by days since symptom onset.

