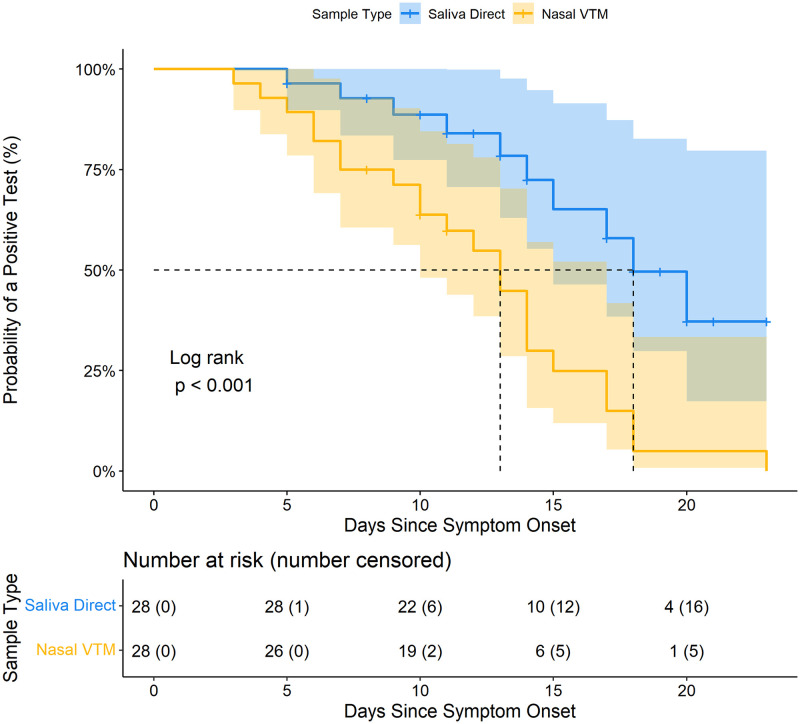
Fig 7. SARS-CoV-2 survival curve in longitudinal cohort saliva and nasal specimens.
Kaplan-Meier estimate of probability of a positive test for SARS-CoV-2 in saliva direct and nasal VTM specimens over time in days since symptom onset for the longitudinal cohort. Dashed lines indicate median survival times.

