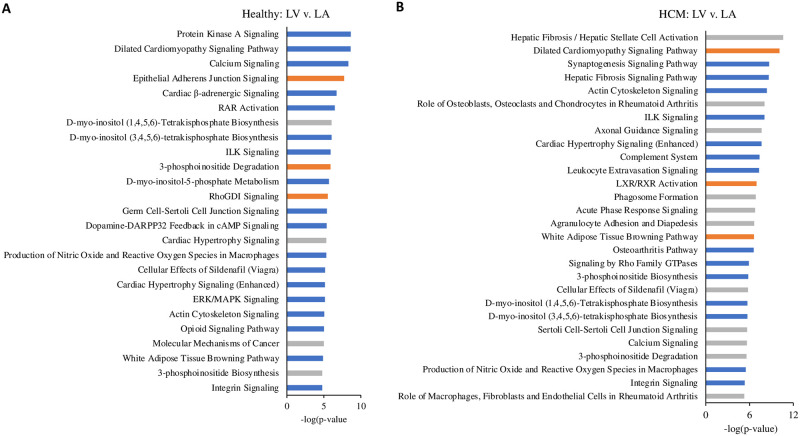
Fig 3. Top canonical pathways in the left ventricle (LV) compared to the left atrium (LA).
The biological and disease pathways most affected by the altered gene expression levels in the LV compared to the LA, based on analysis of healthy hearts (A) and hearts from cats with HCM (B). All genes in the analysis were filtered P-value <0.01 and their positive or negative expression was identified based on their Z-score. Line colors indicate significantly increased expression (orange), significantly decreased expression (blue), and no direction (gray).

