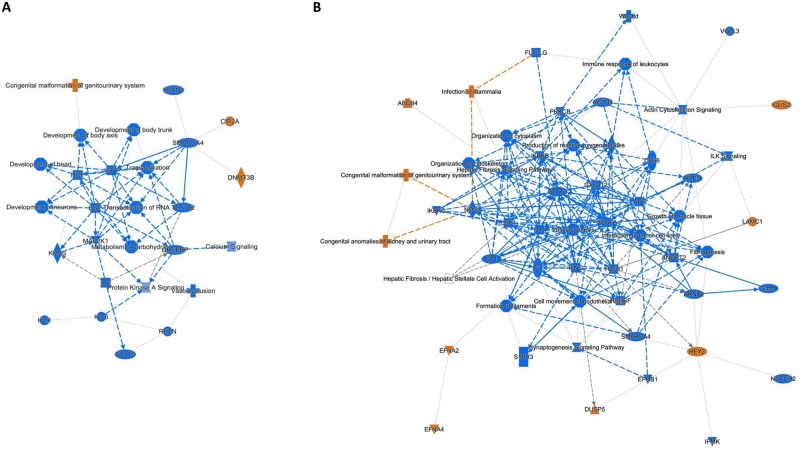
Fig 4. Network analysis in the left ventricle (LV) compared to left atrium (LA).
Graphical summary of the IPA core analysis shows major pathways, regulators and processes within the LV compared to the LA based on analysis of hearts from healthy cats (A) and those with HCM (B). Network analysis shows interactions between differentially expressed genes within each group. Node and line colors indicate significantly increased expression (orange), significantly decreased expression (blue), and no direction (gray). For each function, z-scores were used to predict activation or inhibition. Lines and arrows between nodes represent direct interactions (solid) and indirect interactions (dashed) between molecules. Node shapes symbolize the functional class of genes: enzymes (diamond), phosphatases (triangle), complexes or groups (circle and hourglass), transcriptional regulators or modulators (oval) and cytokines (rectangle).

