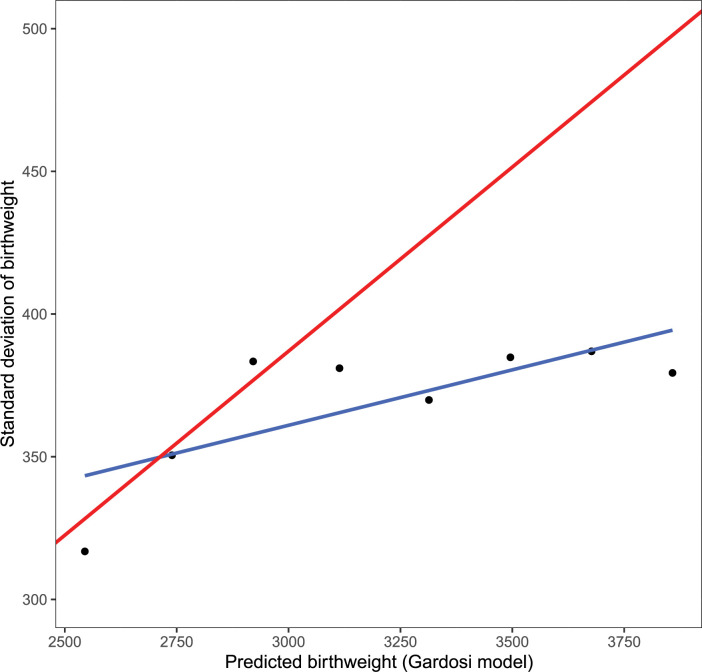
Fig 2. Empirical and Gardosi model based standard deviation of birthweight at different levels of mean birthweight.
The constant coefficient variation assumption in Gardosi model would imply the empirical standard deviations would fall along a straight line (red line) with constant CV value as its slope. However, the empirical based fitted line (blue line) differs from the line based on the Gardosi assumption and the empirical points don’t show a linear pattern. Data are from the NICHD Fetal Growth Studies–Singleton. The sample size of each group is 5, 25, 85, 292, 668, 822, 350, and 41 for the point representing the grouped bins from smallest to largest predicted birthweight, respectively.

