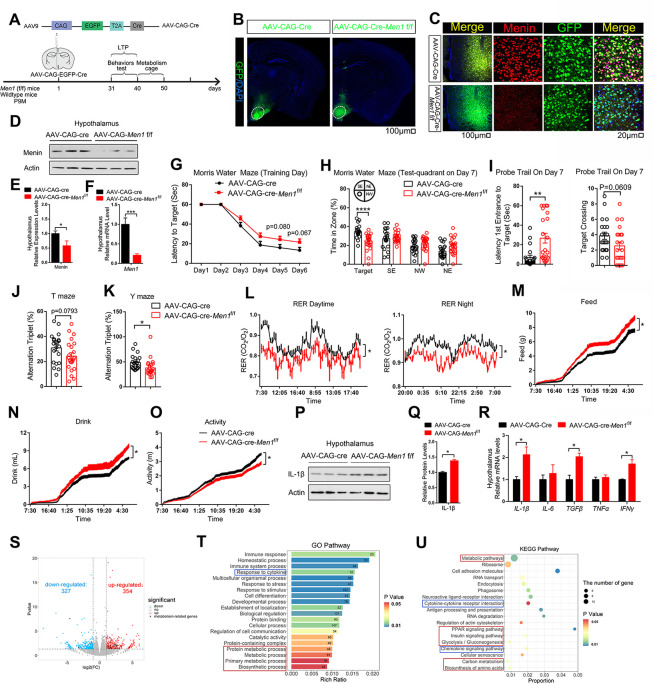
Fig 2. Menin knockdown virus in VMH leads to deficient spatial memory and metabolic disorder.
(A) Schematic diagram of knockdown of Men1 by injection of Cre-dependent CAG-GFP-AAV in VMH of Men1f/f mice and control mice (injection at 9M) that are defined as AAV-CAG-Cre and AV-CAG-Cre-Men1f/f. (B) AAV-GFP immunofluorescence staining in mouse hypothalamus following AAV injection. Scale bar, 100 μm. (C) Representative hypothalamus brain sections from 10 months male AAV-CAG-Cre–injected WT mice and AAV-CAG-Cre–injected Men1f/f mice stained with Menin (red) and GFP (green) antibody. Section was counterstained with DAPI (blue). Scale bar, 100 μm, 20 μm. (D–F) The protein and mRNA levels of Menin in the hypothalamus from 10 months old AAV-CAG-Cre–injected WT and Men1f/f mice; n = 3 mice. (G–K) Morris water maze (G–I), T maze (J) and Y maze (K) tests were performed in 10 months male AAV-CAG-Cre–injected WT and Men1f/f mice (AAV-CAG-Cre/AAV-CAG-Cre-Men1f/f). During Morris water maze tests, 10 months male AAV-CAG-Cre–injected WT and Men1f/f mice were analyzed for escape latency during a 6-day training period (G). On the next day, mice were analyzed for time spent in the target zone and other quadrants (northeast, southeast, and northwest) (H), number of target crossings and time required from entrance to the target platform (I). (L) Day and night respiratory quotients (RER) of 10 months male AAV-CAG-Cre mice and age-matched AAV-CAG-Cre-Men1f/f mice were measured. Exact dietary (M), water intake (N), and activity (O) were also measured. (P–R) Inflammatory factors protein expression and mRNA levels in the hypothalamus of 10 months male AAV-CAG-Cre mice and AAV-CAG-Cre-Men1f/f mice; n = 3 mice. (S–U) DEGs were identified from the hypothalamus of 13 months male ScKO mice and control mice and were shown in panel S. DEGs then were analyzed by GO pathway (T) and KEGG pathway (U). The red box represents the enriched metabolic pathway. The blue box represents the enriched cytokine pathway; n = 3 mice. Mouse number used in measuring energy expenditure by open circuit indirect calorimetry: AAV-CAG-Cre mice: n = 8 mice; AAV-CAG-Cre-Men1f/f mice: n = 8 mice. Mouse number used in behavior tests: AAV-CAG-Cre mice: n = 21 mice; AAV-CAG-Cre-Men1f/f mice: n = 22 mice. Data represent mean ± SEM, n.s.: not significant, *p < 0.05, **p < 0.01, ***p < 0.001. Unpaired t test for behavioral statistics. Statistical applications between groups across multiple time points were analyzed by repeated-measures ANOVA. Other statistical applications were analyzed by one-way ANOVA with Tukey’s post hoc analysis. The underlying data of Fig 2 can be found in S2 Information. DEG, differentially expressed gene; VMH, ventromedial hypothalamus.

