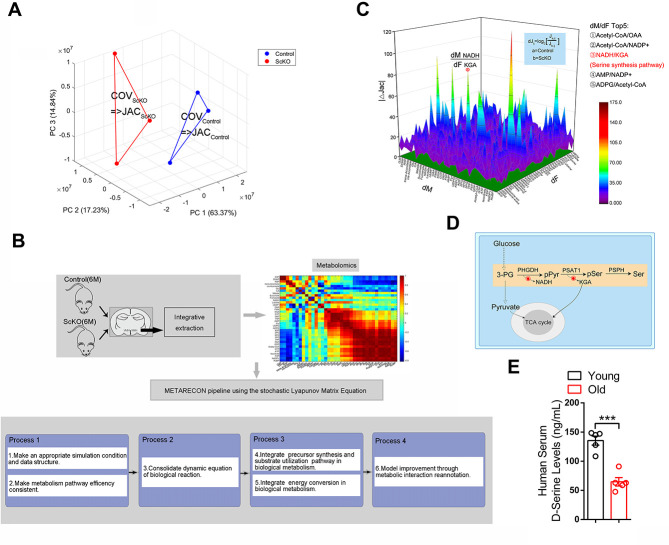
Fig 3. Menin deficiency results in disrupted metabolism in the hypothalamus.
(A) PCA of the metabolomics data revealing an obvious separation between the hypothalamus of 13-month-old ScKO mice and control mice. (B) For inverse modeling of biochemical regulation from metabolomics covariance data, a metabolic reconstruction and pathway reduction from metabonomics is performed (RECON). The metabolite variance of 2 groups is visible, which is further exploited for the calculation of the Covariance matrix (COV) and subsequently for the Jacobian matrix (JAC) using the stochastic Lyapunov matrix Eq 1 (see the METARECON strategy in Materials and methods). (C) Differential Jacobian matrix of the hypothalamus of 13-month-old ScKO mice and control mice derived from covariance data from the metabolomics datasets. All entries represent median values of 103 calculations normalized to the square of interquartile distance. dF and dM characterize the entries of the Jacobian matrix and refer to Eq 2 (see the METARECON strategy in Materials and methods). The greatest perturbation was identified as the Jacobian entry ðfNADH = ðfKGA, pointing to D-serine synthesis pathway in the underlying biochemical network in panel D. (D) Simplified biochemical interaction network of D-serine synthesis pathway adjusted to the measured metabolites. (E) D-serine levels in serum from young (22-26Y) and old individuals (83-94Y) were determined by ELISA; n = 5. Data represent mean ± SEM, n.s.: not significant, *p < 0.05, **p < 0.01, ***p < 0.001. Statistical applications were analyzed by one-way ANOVA with Tukey’s post hoc analysis. The underlying data of Fig 3 can be found in S3 Information. PCA, principal component analysis.

