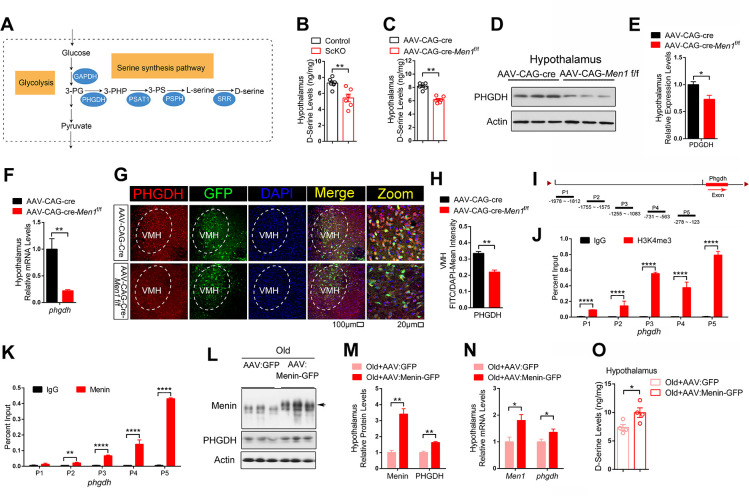
Fig 4. Menin deficiency results in disrupted D-serine synthesis in the hypothalamus.
(A) Schematic diagram of D-serine synthesis pathway. (B, C) D-serine levels in lysates of the hypothalamus from 10 months male control and ScKO mice (B), and 10 months male AAV-CAG-Cre and AAV-CAG-Cre-Men1f/f mice (C) were determined by ELISA; n = 6 mice. (D–F) The protein and mRNA levels of PHGDH in the hypothalamus from 10 months male AAV-CAG-Cre and AAV-CAG-Cre-Men1f/f mice were measured; n = 3 mice or n = 6 mice, respectively. (G, H) Immunofluorescent staining of PHGDH (red) and GFP (green) in the hypothalamus region from 10 months male AAV-CAG-Cre and AAV-CAG-Cre-Men1f/f mice. Representative confocal images are shown on panel G. Scale bar, 100 μm, 20 μm. Quantitation of fluorescence intensity of PHGDH are showed in panel H; n = 3 mice. (I) Schematic diagram of phgdh promoter region. (J, K) ChIP assays using antibodies against H3K4me3 or Menin were performed in cultured wild-type neurons on DIV 12; n = 3 independent experiments. (L–N) AAV-Menin-GFP virous or control virous AAV-GFP were injected into the hypothalamus region of 20 months male mice (Old+AAV:GFP; Old+AAV:Menin-GFP). The protein and mRNA levels of Menin and PHGDH were measured in the hypothalamus of above mice; n = 3 mice. (O) D-Serine levels in the hypothalamus from 20 months male Old+AAV:GFP and Old+AAV:Menin-GFP mice were determined by ELISA; n = 4 mice. Data represent mean ± SEM, n.s.: not significant, *p < 0.05, **p < 0.01, ***p < 0.001, one-way ANOVA with Tukey’s post hoc analysis. The underlying data of Fig 4 can be found in S4 Information. ChIP, chromatin immunoprecipitation; PHGDH, phosphoglycerate dehydrogenase.

