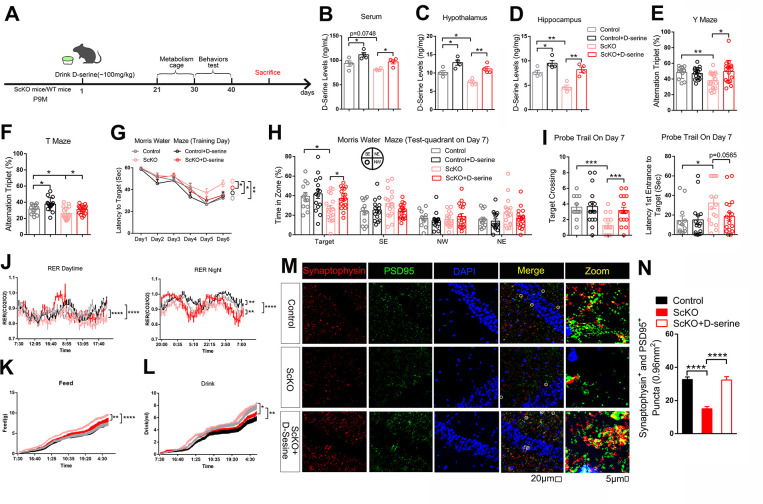
Fig 7. D-Serine supplement reduces cognitive decline in ScKO mice.
(A) Schematic diagram of chronic oral D-serine supplementation (drinking water for 3 weeks). (B–D) D-serine levels in serum and lysates of hypothalamus and hippocampus from 10 months male control mice, control +D-serine mice, ScKO mice and ScKO+D-serine mice were determined by ELISA; n = 4 mice. (E–I) Behavioral tests of the above mice by Y maze (E), T maze (F), and Morris water maze tests (G–I). (J–L) The above mice were subjected to measure energy expenditure by open circuit indirect calorimetry. Day and night respiratory quotients (J), Exact dietary (K), and feed/water intake (L) were measured. (M, N) Immunofluorescent staining of synaptophysin (red) and PSD95 (green) in hippocampus from 10 months male control mice, ScKO mice, and ScKO+D-serine mice. Representative confocal images are shown on panel N. Scale bar, 20 μm, 5 μm. Quantitation of number of puncta of synaptophysin and PSD95 are showed in panel O, n = 6 slices from 3 mice. Mouse number used in behavior tests: Control: n = 12 mice, Control+ D-serine supplementation: n = 16 mice, ScKO: n = 15 mice, ScKO+ D-serine supplementation: n = 18 mice. Mouse number used in measuring energy expenditure by open circuit indirect calorimetry: Control: n = 8 mice, Control+ D-serine supplementation: n = 8 mice, ScKO: n = 8 mice, ScKO+ D-serine supplementation: n = 8 mice. Data represent mean ± SEM, n.s.: not significant, *p < 0.05, **p < 0.01, ***p < 0.001, ****p < 0.0001. Unpaired t test for behavioral statistics. Statistical applications between groups across multiple time points were analyzed by repeated-measures ANOVA. Other statistical applications were analyzed by one-way ANOVA with Tukey’s post hoc analysis. The underlying data of Fig 7 can be found in S7 Information.

