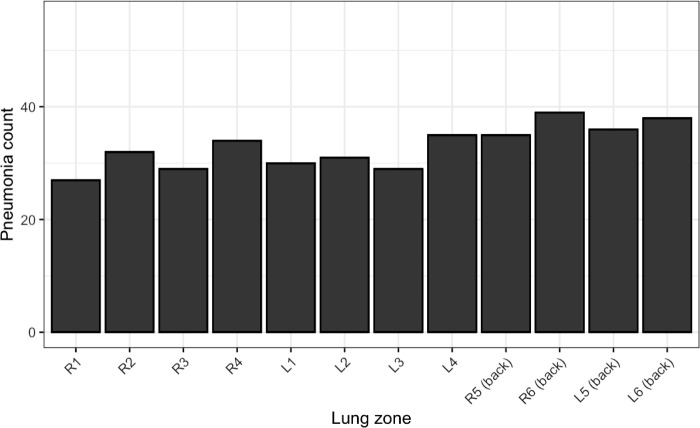
Fig 4. Distribution of pneumonia.
The X-axis represents the zone of the lung (R1, right anterior superior zone; R2, right anterior inferior zone; R3, right lateral superior zone; R4, right lateral inferior zone; R5, right superior dorsal zone; R6, right inferior dorsal zone; Ls are left zones corresponding to Rs), and the Y-axis represents the number of patients with pneumonia in each zone.

