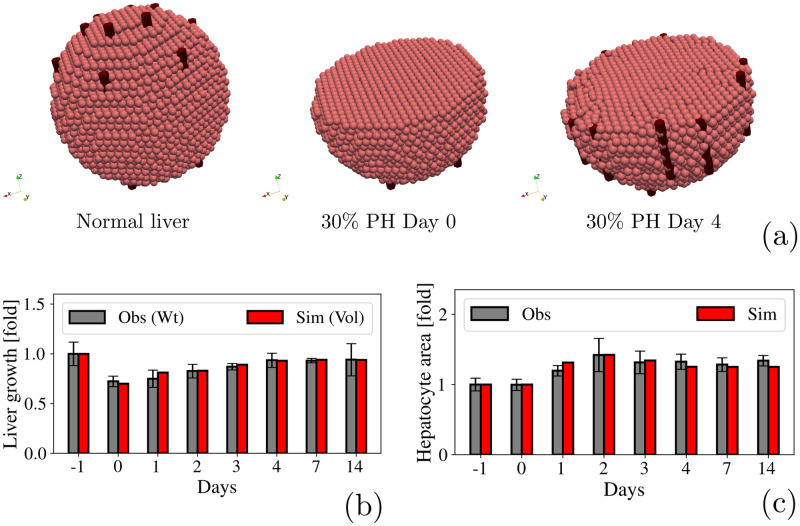
Fig 5. 30% PH.
(a) Qualitative representation of the liver regeneration process after a 30% PH. (b) Fold-increase in the liver size. Observational data is shown in gray and represents the weight of the liver measured by Miyaoka et. al [44, 45]. Simulated data is shown in red and represents the liver volume. (c) Quantification of the hepatocytes area during liver regeneration.

