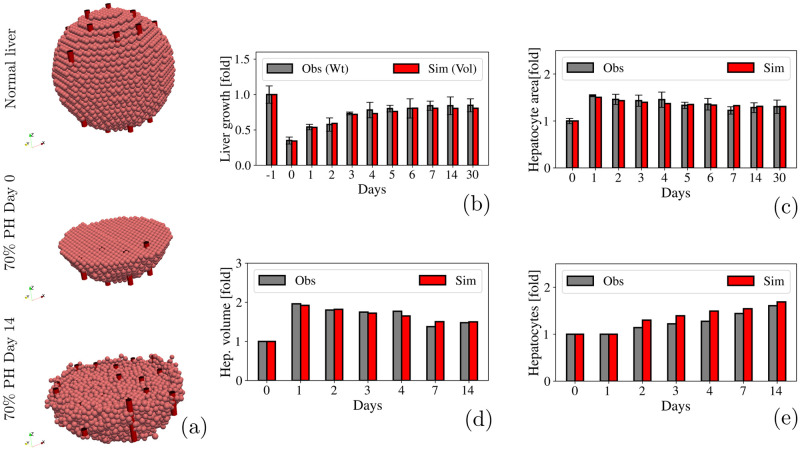
Fig 6. 70% PH.
(a) Qualitative representation of the liver regeneration process after a 70% PH. (b) Fold-increase in the liver size. Observational data is shown in gray and represents the weight of the liver measured by Miyaoka et. al [44, 45]. Simulated data is shown in red and represents the liver volume. (c) Quantification of the hepatocytes area during liver regeneration. (d) Quantification of the hepatocytes volume during liver regeneration. (e) Fold-increase in the number of hepatocytes during liver regeneration.

