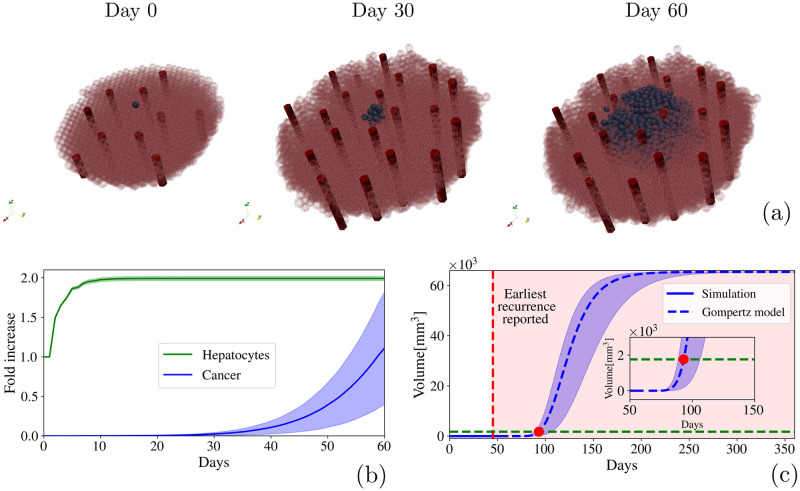
Fig 10. Hepatocellular carcinoma.
(a) Schematic representation of the recurrence of a hepatocellular carcinoma after a 70% PH. Hepatocytes are represented by transparent pink cells to have a better view of the blood vessels (red tubes) and the tumor (blue cells) growth (b) Fold-increase in liver regeneration and hepatocellular carcinoma recurrence. (c) Time based volume estimation of the hepatocellular carcinoma by using simulation data (blue line) to adjust a Gompertz model growth curve (blue dotted line). Red dotted line represents the earliest recurrence reported in clinical observations and the red point along with the green dotted line,represents the minimum volume that the tumor must reach to be detected (5 mm) by imaging diagnose.

