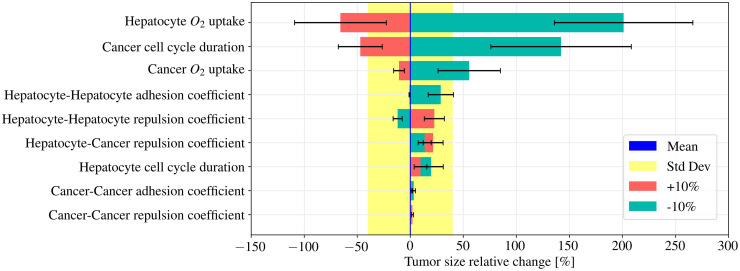
Fig 11. Sensitivity study.
Relative change of the tumor final size, based on the variation of the parameters that feed our model. The blue line represents the mean tumor size, the yellow shaded region represents the standard deviation of the mean value based on the stochasticity of the model. Red bars and blue bars represent the mean value of the tumor growth when the parameter original value is increased and decreased by 10% respectively and the error bars represent the standard deviation. The three parameters most likely to make an impact on the tumor growth are: the hepatocyte oxygen uptake constant, cancer cells cycle duration and cancer cells oxygen uptake constant.

