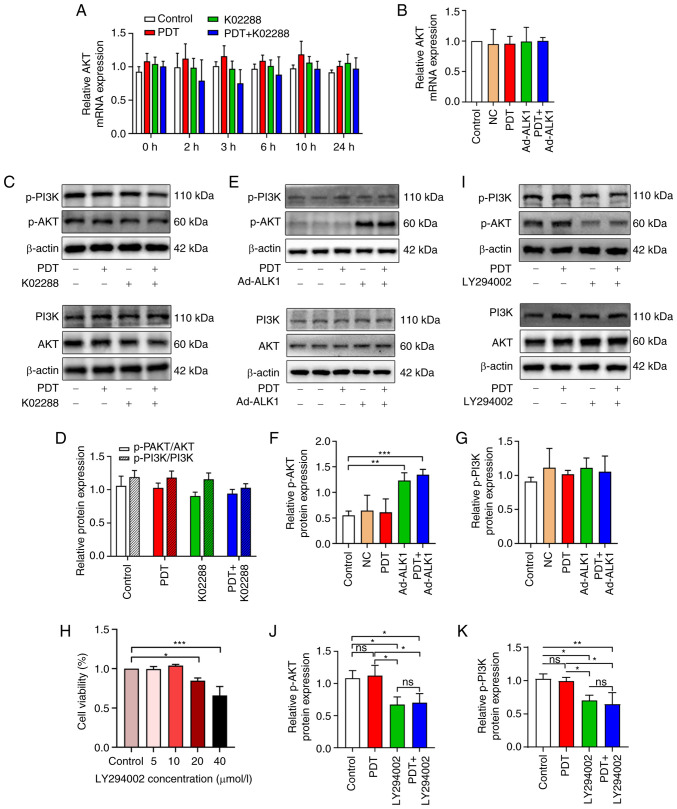
Figure 7.
The association between tumour angiogenesis induced by low-dose PDT and the PI3K/AKT pathway. (A) The expression of AKT in the control, PDT, K02288 and PDT + K02288 groups at different time points (0, 2, 3, 6, 10 and 24 h). (B) The expression of AKT at 2 h in the control, NC, PDT, Ad-ALK1 and PDT + Ad-ALK1 groups. (C and D) The protein expression of AKT, p-AKT, PI3K and p-PI3K in the control, PDT, K02288 and PDT + K02288 groups after 24 h of treatment. (E-G) The protein expression of AKT, p-AKT, PI3K and p-PI3K in the control, PDT, Ad-ALK1 and PDT + Ad-ALK1 groups after 24 h of treatment. (H) Effects of various PI3K inhibitor (LY294002) concentrations (5, 10, 20 and 40 µmol/l) on HU-231 cell viability. (I-K) Protein expression of AKT, p-AKT, PI3K and p-PI3K in the control, PDT, LY294002 and PDT + LY294002 groups after 24 h of treatment *P<0.05, **P<0.01 and ***P<0.001. ns, not significant (P>0.05); NC, negative control; Ad, adenovirus; p-, phosphorylated; PDT, photodynamic therapy; ALK1, activin receptor-like kinase-1.

