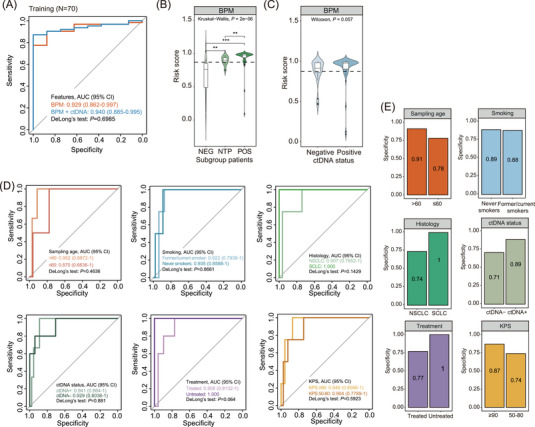
FIGURE 2.

Development of the BPM model. (A) ROC curves evaluating the performance of brain metastases (BM) predictive models (BPM and integrated) in distinguishing BM‐positive patients from BM‐negative patients in the training cohort (N = 70). (B and C) Violin plots illustrating the BM risk score distribution in patient subgroups classified based on BM status (B) or ctDNA status (C) built on the BPM model. The optimal cutoff for the risk score was 0.8714, as shown by the dotted line. (D) ROC curves evaluating the performance of the BPM model in specified subgroup patients of the training dataset (N = 70). P values indicate the significance levels of the model's performance in two matched cohorts computed by DeLong's test. (E) Bar plots illustrating the diagnostic specificities of the BPM model at 90% sensitivity for subgroup patients, comparing patients’ sampling age, smoking history, histology, ctDNA status, treatment history and KPS.
