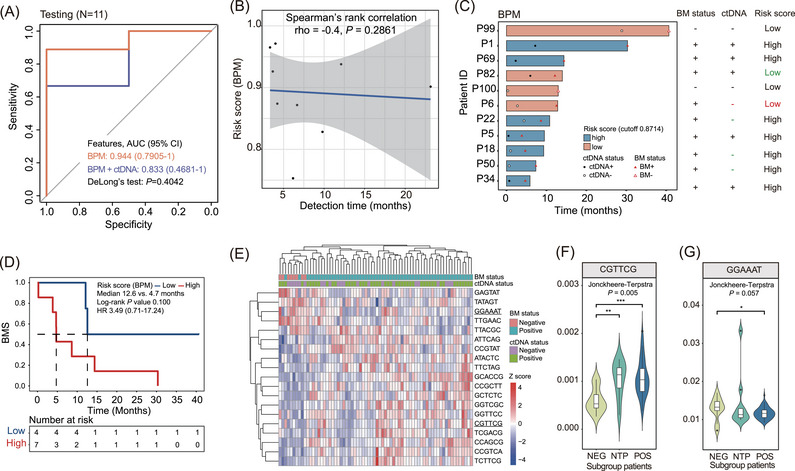
FIGURE 3.

Evaluation of the breakpoint motif (BPM) model. (A) Receiver operating characteristics (ROC) curves evaluating the performance of brain metastases (BM) predictive models in distinguishing BM‐positive patients from BM‐negative patients in the testing cohort (N = 11). (B) Correlation plot evaluating the relationship between the risk score computed by the BPM model and BM detection time in the testing cohort. (C) Schematic demonstration of the lead time of the BPM model in distinguishing high‐risk patients from low‐risk patients for each subject in the testing cohort. Patients were classified into two subgroups based on the cutoff value of 0.8714 of the BPM model obtained from the training cohort. Green colour labels wrong predictions by cerebrospinal fluid (CSF) circulating tumour DNA (ctDNA) status or the BPM model. Red colour labels wrong predictions by both screening methods. (D) Kaplan Meier curves estimating the BM‐free survival (BMS) of patients in the testing cohort with a high risk of developing BM compared to those with low risk computed by the BPM model. (E) Hierarchical clustering analysis of BPM with non‐zero coefficients in the training cohort. Underlined motifs had the greatest positive and negative coefficients in the model. (F and G) Violin plots showing frequencies of the CGTTCG motif (F) and the GGAAAT motif (G) in three patient subgroups categorized based on patients’ BM status (N = 81). One‐sided Jonckheere‐Terpstra tests were used to test the trend in ordered patient cohorts (in order of NEG, NTP and POS).
