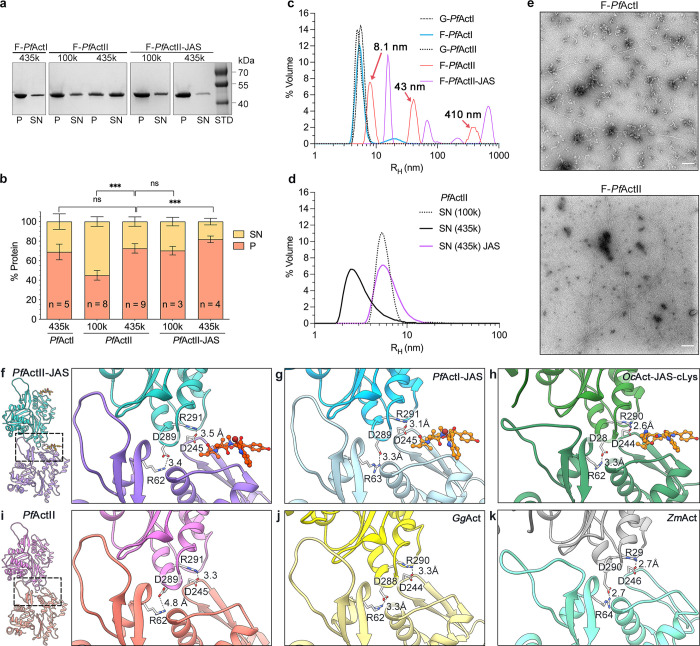
Fig 7. Polymerized Plasmodium actins.
(a). SDS-PAGE of a standard sedimentation assay of actin I and actin II, where the pellet (P), and supernatant (SN) fractions have been separated by ultracentrifugation at 4°C for 1 h. (b). Quantification of the sedimentation assays expressed as the percentage of protein in each fraction after ultracentrifugation at 100000 or 435000 g. The samples were polymerized in the presence or absence of JAS in a ratio of 1:1. (c-d) DLS profile of Plasmodium actins.The 8.1, 43, and 410 nm peaks in the F-PfActII sample (panel c, red curve) are indicated with arrows. (e). EM micrographs of polymerized Actin I (1 μM) and actin II (2 μM). Scale bars represent 100 nm. (f-k) Salt bridge interactions between two adjacent protomers. Actin filaments in the presence of JAS (f) actin II, (g) actin I (6TU4), (h) α-actin (5OOC). Structures without JAS (i) actin II, (j) α-actin (6DJO), (k) Z. mays actin (6IUG). Distances are indicated with black dashed lines. The error bars represent the standard deviation, ***<0.001, *<0.05, and ns: not significant, two-tailed Student’s t-test. Raw data related to panel b can be found in S3 Data and panels c and d in S4 Data.

