Figure 3.
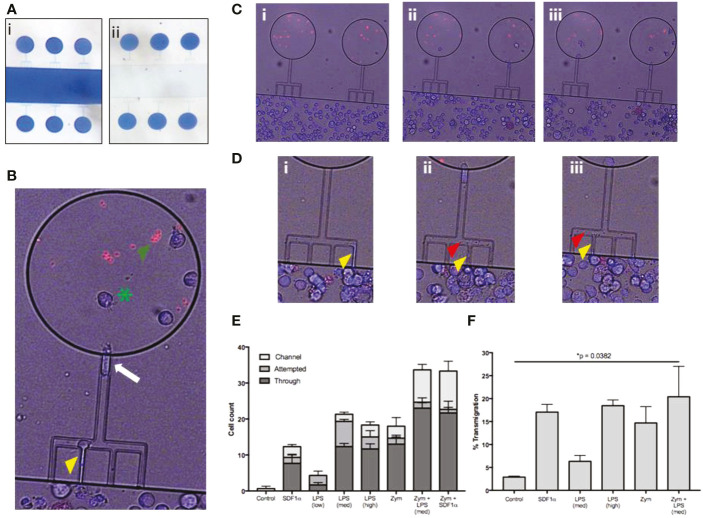
Meg-01 cells are capable of chemotaxis to pathogenic stimulus. Meg-01 cells were tested for their ability to chemotax towards LPS and zymosan particles. (A) A microfluidic device was used for part of the chemotaxis experiments. In this device, the main channel is connected to a circular reservoir by four 6 µm wide channels and a larger 8 µm wide connecting channel in a comb-like arrangement. The device is first primed with the condition (panel i) and the main channel is then flushed with media in order to create a concentration gradient from the chemoattractant chambers into the main channel (panel ii). (B) The MKs were stained with Hoechst for positive identification and then manually tracked. The behavior of the MKs was divided into 3 categories: cells attempting to enter the channel (yellow arrowhead), cells inside the channel (white arrow), and cells through the channel and inside the reservoir (green arrowhead). Zymosan particles are marked with a green asterisk. (C) Time lapse image of MKs migrating into chambers primed with LPS (360 pg/mL) and zymosan particles (Ci, no cells in the chambers with the red zymosan particles; (Cii), cells starting to migrate up the combs into the zymosan chambers; (Ciii) final timepoint with multiple cells in each zymosan chamber). (D) Close-up of time-lapse imaging where MKs were observed attempting to enter the channel, extend a portion of the cell into the side channel (yellow arrowhead) (Di–Diii), and then bud off small platelet-like particles (red arrowhead) (Dii, Diii). Additionally, a single MK is followed shown throughout this timelapse first entering the comb (Di) and then finally entering the chamber (Diii). (E) Bar graph representing MK chemotaxis within the microfluidic device. (F) Bar graph representing MK chemotaxis in a transwell assay, confirming the observations made with the microfluidic device. Statistical analysis for (E, F) are One-way ANOVAs with results in detail in Figure S4 . LPS low, 22 pg/mL; LPS med, 220 pg/mL; LPS high, 2.2 ng/mL; Zym, zymosan particles; Zym+LPS, zymosan particles with 220 pg/mL LPS. Bar graphs are mean with standard error bars.

