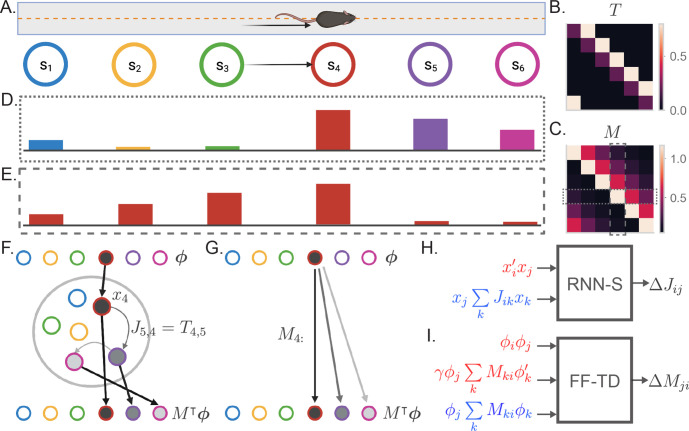
Figure 1. The successor representation and an analogous recurrent network model.
(A) The behavior of an animal running down a linear track can be described as a transition between discrete states where the states encode spatial location. (B) By counting the transitions between different states, the behavior of an animal can be summarized in a transition probability matrix . (C) The successor representation matrix is defined as . Here, is shown for . Dashed boxes indicate the slices of shown in (D) and (E). (D) The fourth row of the matrix describes the activity of each state-encoding neuron when the animal is at the fourth state. (E) The fourth column of the matrix describes the place field of the neuron encoding the fourth state. (F) Recurrent network model of the SR (RNN-S). The current state of the animal is one-hot encoded by a layer of input neurons. Inputs connect one-to-one onto RNN neurons with synaptic connectivity matrix . The activity of the RNN neurons are represented by . SR activity is read out from one-to-one connections from the RNN neurons to the output neurons. The example here shows inputs and outputs when the animal is at state 4. (G) Feedforward neural network model of the SR (FF-TD). The matrix is encoded in the weights from the input neurons to the output layer neurons, where the SR activity is read out. (H) Diagram of the terms used for the RNN-S learning rule. Terms in red are used for potentiation while terms in blue are used for normalization (Equation 4). (I) As in (H) but for the feedforward-TD model (Equation 11). To reduce the notation indicating time steps, we use in place of and no added notation for .

