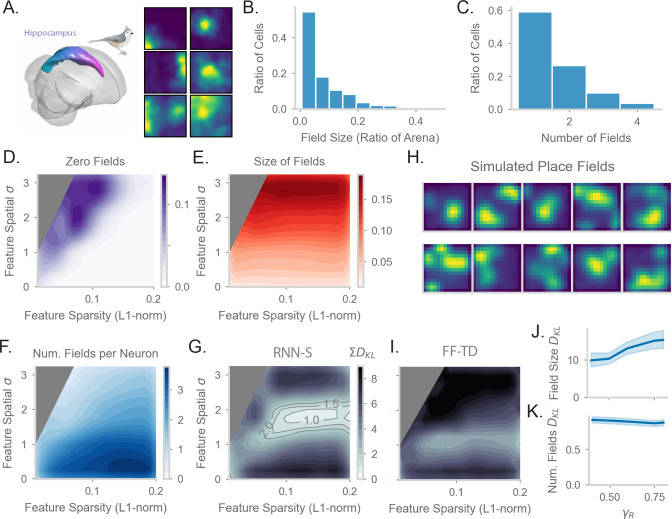
Figure 6. Comparing place fields from RNN-S to data.
(A) Dataset is from Payne et al, where a Tufted Titmouse randomly forages in a 2D environment while electrophysiological data is collected (replicated with permission from authors). (B) Distribution of place cells with some number of fields, aggregated over all cells recorded in all birds. (C) Distribution of place cells with some field size as a ratio of the size of the arena, aggregated over all cells recorded in all birds. (D) Average proportion of non-place cells in RNN-S, aggregated over simulations of randomly drawn trajectories from Payne et al. Feature encodings are varied by spatial correlation and sparsity as in Figure 5. Each simulation used 196 neurons. As before, three simulations were run for each spatial correlation and sparsity pairing under each chosen . (E) As in (D), but for average field size of place cells. (F) As in (D), but for average number of fields per place cell. (G) As in (D) and (E), but comparing place cell statistics using the KL divergence () between RNN-S and data from Payne et al. At each combination of input spatial correlation and sparsity, the distribution of field sizes is compared to the neural data, as is the distribution of number of fields per neuron, then the two values are summed. Contour lines are drawn at values of 1, 1.5, and 2 bits. (H) Place fields of cells chosen from the region of lowest KL divergence. (I) As in (G) but for FF-TD. (J) Change in KL divergence for field size as function of . Line shows mean, and shading shows 95% confidence interval. (K) Same as (J), but for number of fields.


