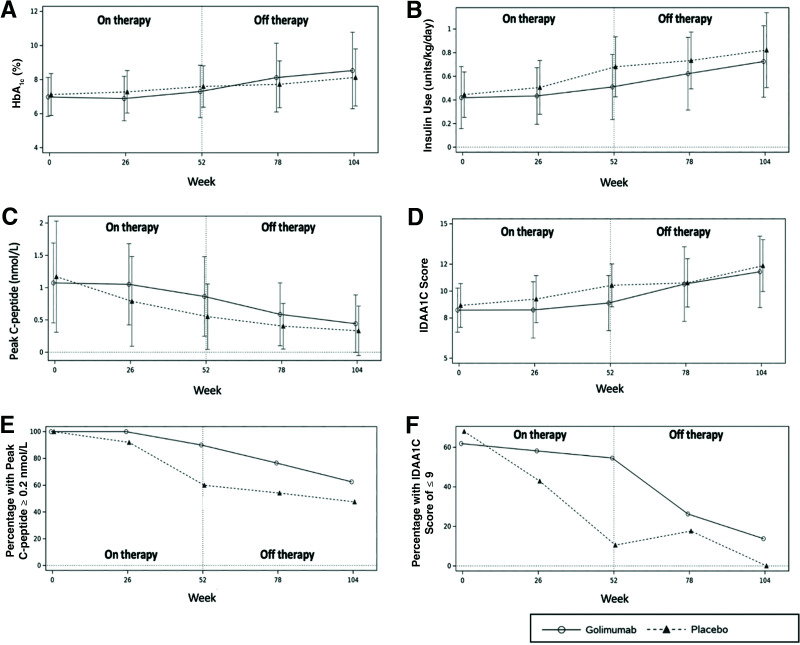
Figure 2.
Additional metabolic analyses in the in golimumab group as a whole vs. the placebo group from baseline to week 104. HbA1c (A), exogenous insulin use (B), peak C-peptide levels (C), and IDAA1C score (D). E: Percentage of participants with C-peptide ≥0.2 nmol/L. F: Percentage of participants in T1D partial remission, defined as an IDAA1c score of ≤9.

