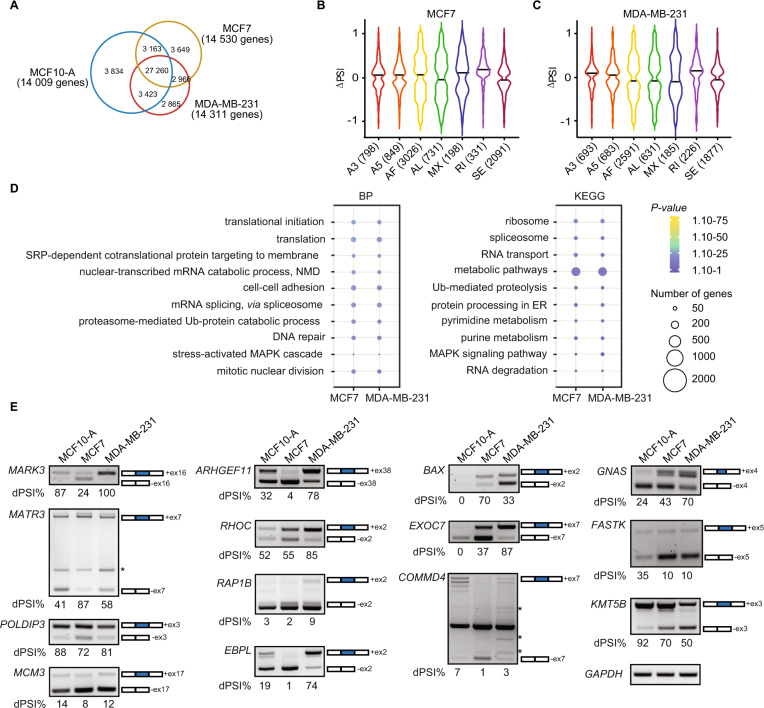
Fig. 1. Identification of AS events in non-tumorigenic and breast cancer cell lines.
A Venn diagrams showing the number of common alternative splicing events and genes in the non-tumorigenic mammary epithelial cell line MCF10-A and the breast cancer cell lines MCF7 and MDA-MB-231. Violin plots of changes of the significant percent splicing inclusion (∆PSI) in the breast cancer cell lines (B) MCF7 and (C) MDA-MB-231 related to the normal mammary epithelial cell line MCF10-A. D Dot plots representing the Gene Ontology enrichment (GO) analysis of the common spliced genes in MCF7 and MDA-MB-231. BP biological process, KEGG KEGG pathways. The size and the color of the dots are proportional to the number of genes enriched in each GO term and the significance of the enrichment (1.10−75 < P-value < 1.10−1), respectively. E RT-PCR showing the different splicing events between the non-tumorigenic MCF10-A and breast cancer MCF7 and MDA-MB-231 cell lines. The number of the skipped exons are depicted for each transcript. The PSI was calculated in percentage for each gene. Non-specific bands are indicated with an asterisk.

