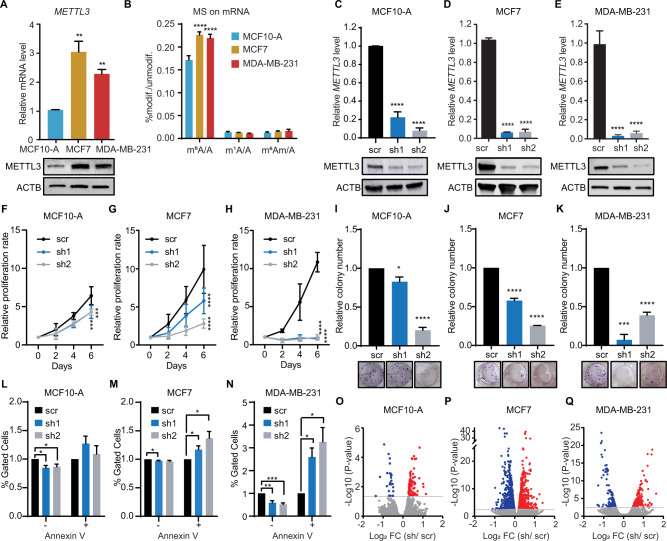
Fig. 2. METTL3 promotes cell growth in breast cancer cell lines.
A RT-qPCR analysis of METTL3 mRNA level (upper) in the non-tumorigenic mammary epithelial cell line MCF10-A and the breast cancer cell lines MCF7 and MDA-MB-231. METTL3 is normalized to β-ACTIN. Western blot of METTL3 (lower) on whole cell extracts (WCE) from MCF10-A, MCF7 and MDA-MB-231 cell lines. β-ACTIN (ACTB) is used as the loading control. B LC-MS/MS quantification of m6A, m1A and m6Am in mRNA of MCF10-A, MCF7 and MDA-MB-231 cell lines. Methylated adenosines are normalized to the total of unmodified adenosines. RT-qPCR analysis and western blot of METTL3 mRNA and protein levels, respectively in METTL3 knockdown (sh1 and sh2) and scramble (scr) control in MCF10-A (C), MCF7 (D) and MDA-MB-231 (E) cell lines. METTL3 is normalized to β-ACTIN. Cell proliferation rate of scramble (scr) and METTL3 knockdowns (sh1 and sh2) in MCF10-A (F), MCF7 (G) and MDA-MB-231 (H) assessed over 4 days. Colony formation assay in MCF10-A (I), MCF7 (J) and MDA-MB-231 (K) cells in scramble (scr) and upon depletion of METTL3 (sh1 and sh2) at 7 days after seeding. Quantification of the relative number of colonies was calculated with scr set as 1. Percentage of apoptotic cells in control and METTL3 depleted cells in MCF10-A (L), MCF7 (M), and MDA-MB-231 (N) cell lines. + indicates Annexin V positive cells; and – indicates Annexin V negative cells. Volcano plots representing the Log2 fold change of differentially expressed genes upon METTL3 knockdown (sh1 and sh2) in MCF10-A (O), MCF7 (P) and MDA-MB-231 (Q) cell lines in comparison to control cells (scr). The significant up- and down-regulated genes are shown in red and blue, respectively. P-value < 0.05. Data are mean ± SEM; n = 3; ****p < 0.0001; ***p < 0.001; **p < 0.01; *p < 0.05.

